Copyright
©2011 Baishideng Publishing Group Co.
World J Gastroenterol. Aug 21, 2011; 17(31): 3652-3658
Published online Aug 21, 2011. doi: 10.3748/wjg.v17.i31.3652
Published online Aug 21, 2011. doi: 10.3748/wjg.v17.i31.3652
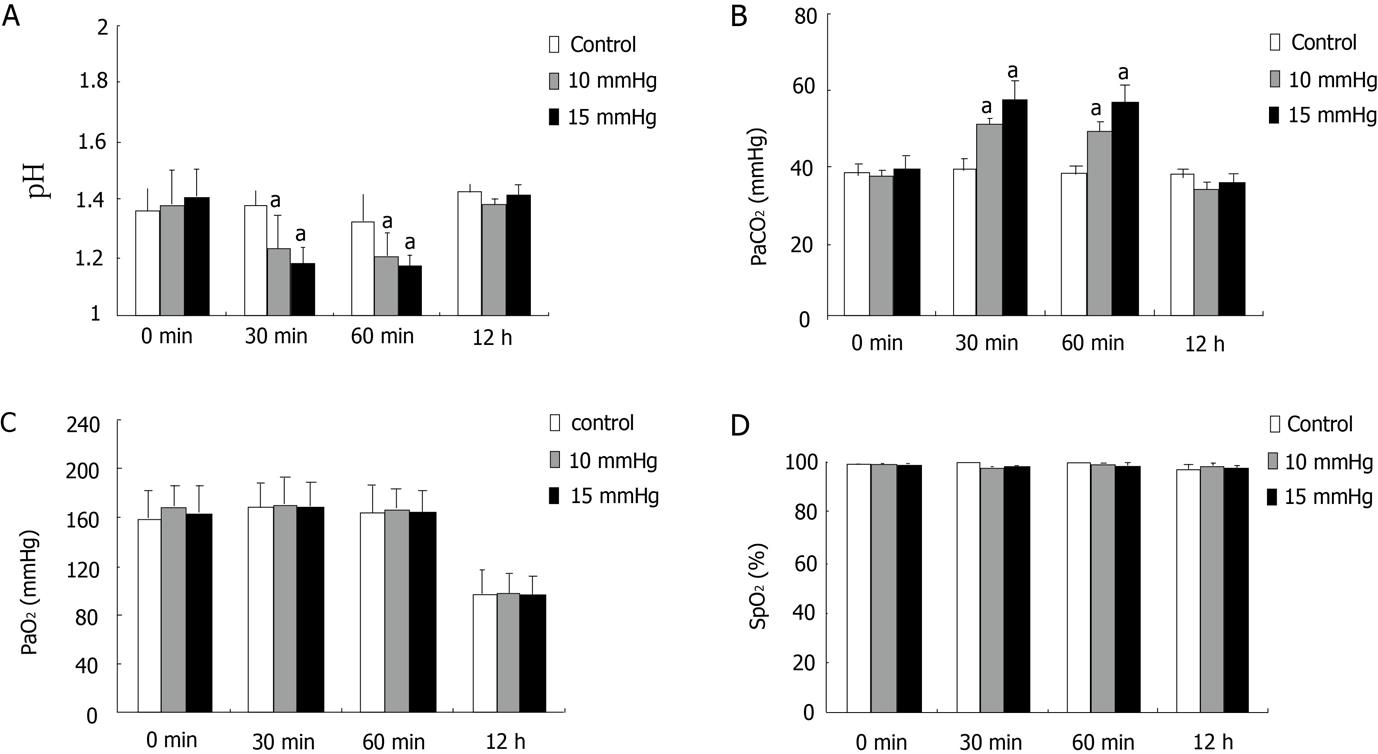
Figure 1 Arterial blood gas analysis.
Data are presented as the mean ± SE (n = 10). aP < 0.05 vs control.
- Citation: Li J, Liu YH, Ye ZY, Liu HN, Ou S, Tian FZ. Two clinically relevant pressures of carbon dioxide pneumoperitoneum cause hepatic injury in a rabbit model. World J Gastroenterol 2011; 17(31): 3652-3658
- URL: https://www.wjgnet.com/1007-9327/full/v17/i31/3652.htm
- DOI: https://dx.doi.org/10.3748/wjg.v17.i31.3652


