Copyright
©2011 Baishideng Publishing Group Co.
World J Gastroenterol. Jan 21, 2011; 17(3): 322-328
Published online Jan 21, 2011. doi: 10.3748/wjg.v17.i3.322
Published online Jan 21, 2011. doi: 10.3748/wjg.v17.i3.322
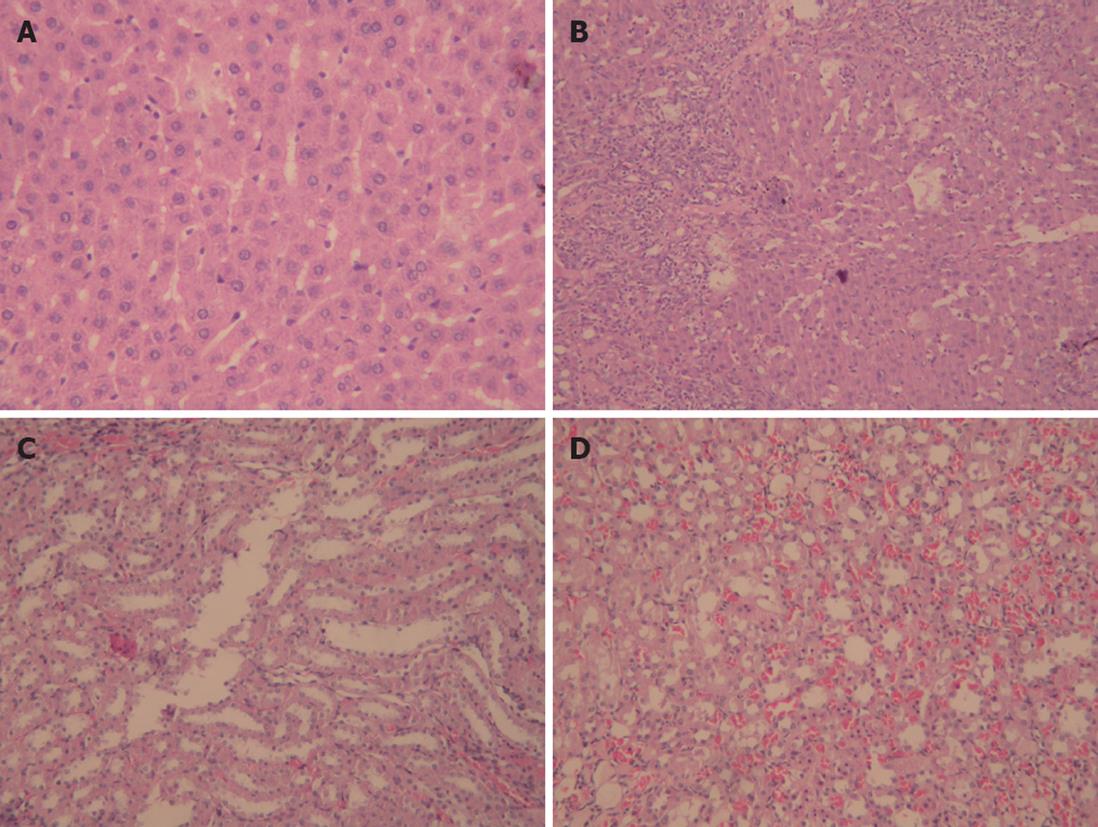
Figure 1 Representative photomicrographs of rats in cirrhotic and sham groups (magnification 200 ×, HE staining).
A: Normal liver structure; B: Liver cirrhosis; C: Normal kidney structure; D: Renal structure in cirrhotic group.
- Citation: Guo SB, Duan ZJ, Li Q, Sun XY. Effect of heme oxygenase-1 on renal function in rats with liver cirrhosis. World J Gastroenterol 2011; 17(3): 322-328
- URL: https://www.wjgnet.com/1007-9327/full/v17/i3/322.htm
- DOI: https://dx.doi.org/10.3748/wjg.v17.i3.322


