Copyright
©2011 Baishideng Publishing Group Co.
World J Gastroenterol. Jul 7, 2011; 17(25): 3002-3011
Published online Jul 7, 2011. doi: 10.3748/wjg.v17.i25.3002
Published online Jul 7, 2011. doi: 10.3748/wjg.v17.i25.3002
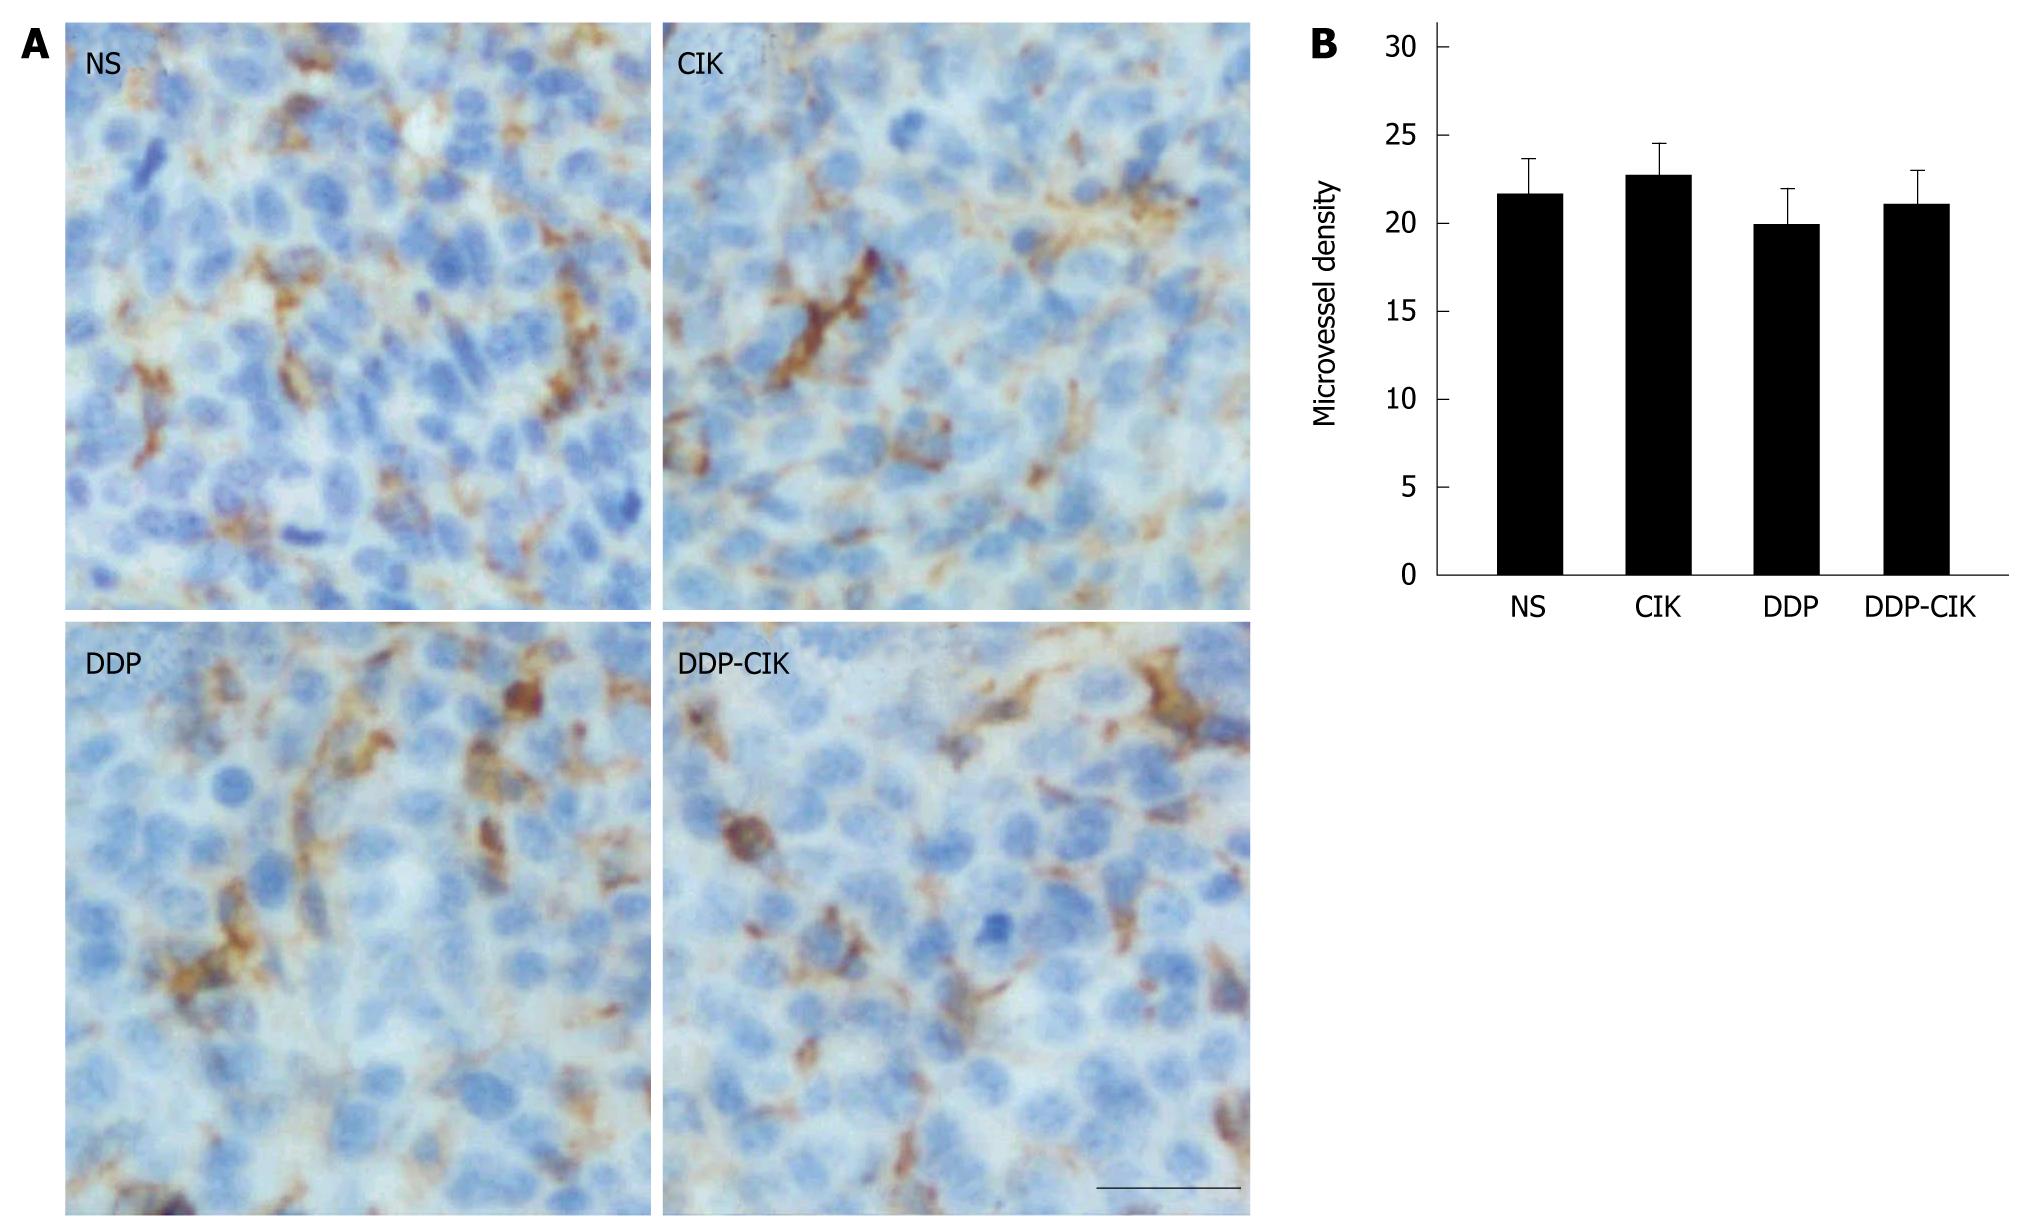
Figure 6 Tumor microvessel density after combination therapy.
BALB/c WT mice were injected s.c. with 1 × 10⁶ CT-26 cells and the treatment protocols were initiated 7 d later. On day 19, tumor sections were prepared and analyzed by CD31 staining (A). Ten individual fields (0.16 mm2) at × 400 magnification were chosen to assess the tumor microvessel density (B). The experimental groups consisted of five mice per group. Representative sections from all groups are shown. Scale bars: 25 μm; Columns: mean microvessel number; Bars: SE.
- Citation: Huang X, Chen YT, Song HZ, Huang GC, Chen LB. Cisplatin pretreatment enhances anti-tumor activity of cytokine-induced killer cells. World J Gastroenterol 2011; 17(25): 3002-3011
- URL: https://www.wjgnet.com/1007-9327/full/v17/i25/3002.htm
- DOI: https://dx.doi.org/10.3748/wjg.v17.i25.3002


