Copyright
©2011 Baishideng Publishing Group Co.
World J Gastroenterol. Jul 7, 2011; 17(25): 3002-3011
Published online Jul 7, 2011. doi: 10.3748/wjg.v17.i25.3002
Published online Jul 7, 2011. doi: 10.3748/wjg.v17.i25.3002
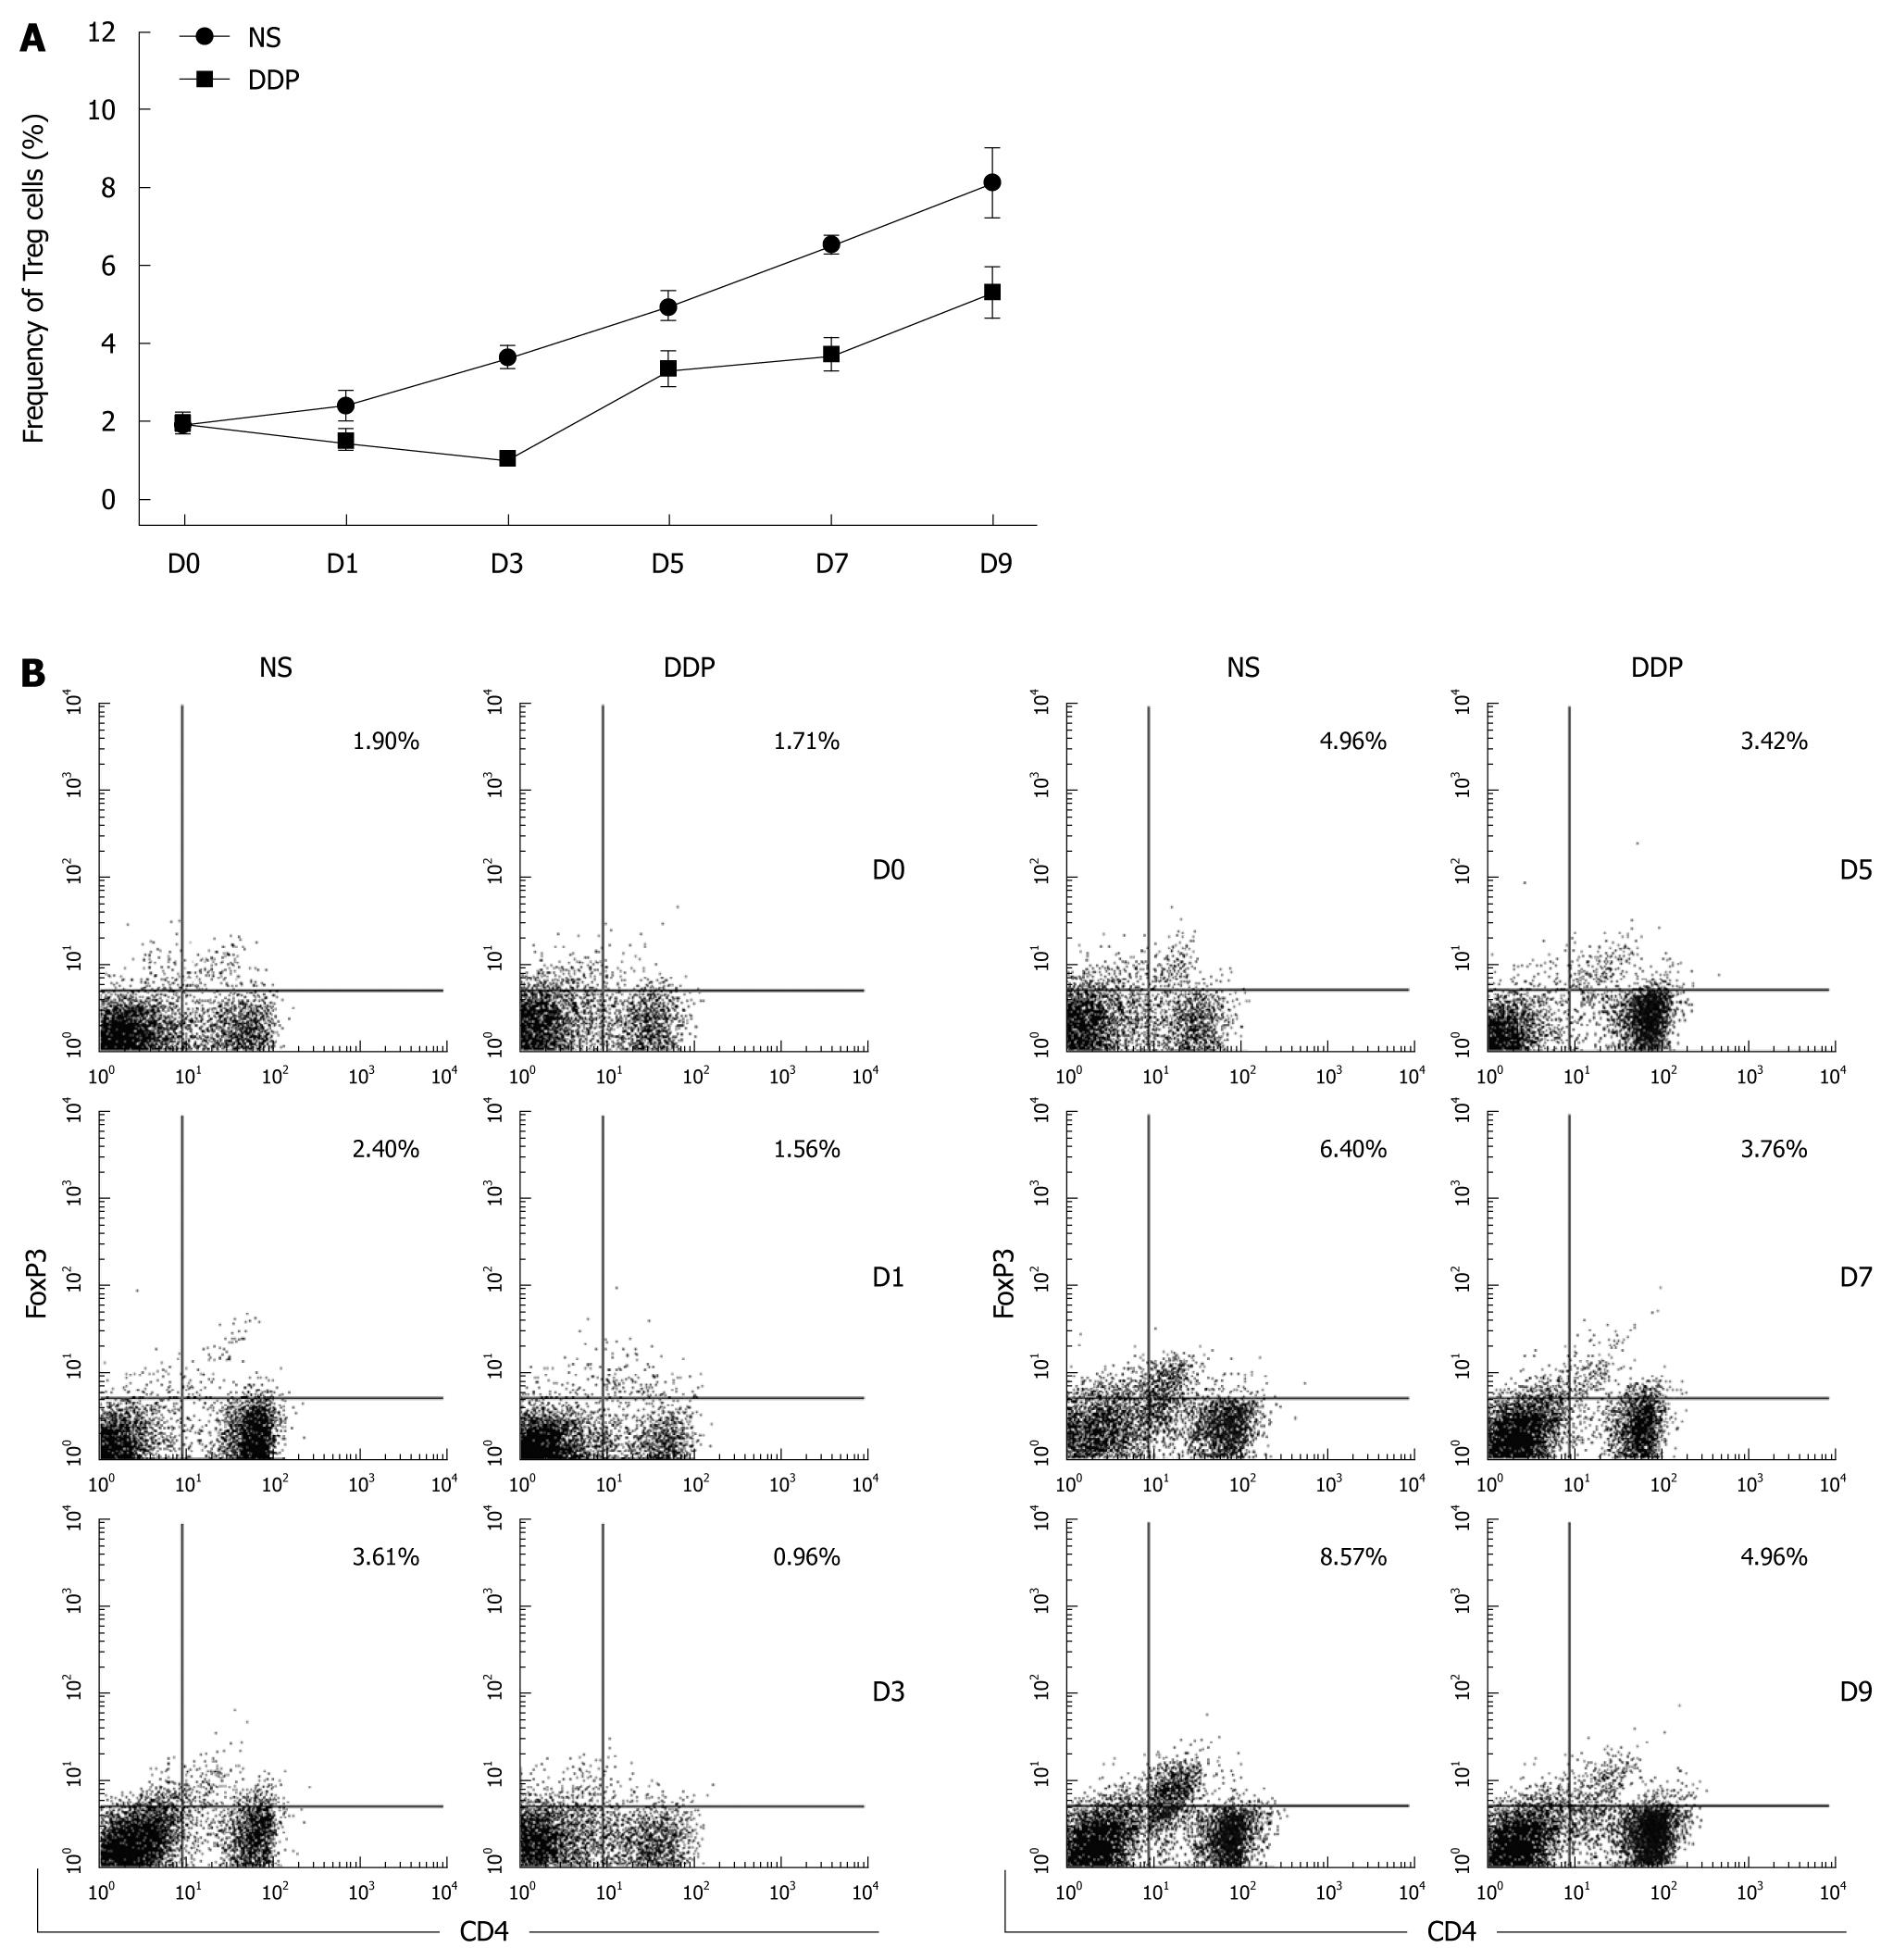
Figure 5 Dynamic changes in the percentage of splenic Tregs after cisplatin (DDP) administration.
BALB/c WT mice were injected s.c. with 1 × 10⁶ CT-26 cells 7 d before treatment. The tumor-bearing mice were treated with DDP (2.5 mg/kg, i.p., D0) and the spleen single cell suspensions prepared to analyze the Treg percentage by flow cytometry at the indicated post-treatment time points (A). Typical data from a representative experiment are shown (B). Points: mean Treg cell percentage (n = 3); Bars: SD. All experiments were performed twice with similar results. NS: Normal saline; DDP: Cisplatin.
- Citation: Huang X, Chen YT, Song HZ, Huang GC, Chen LB. Cisplatin pretreatment enhances anti-tumor activity of cytokine-induced killer cells. World J Gastroenterol 2011; 17(25): 3002-3011
- URL: https://www.wjgnet.com/1007-9327/full/v17/i25/3002.htm
- DOI: https://dx.doi.org/10.3748/wjg.v17.i25.3002


