Copyright
©2011 Baishideng Publishing Group Co.
World J Gastroenterol. Jul 7, 2011; 17(25): 3002-3011
Published online Jul 7, 2011. doi: 10.3748/wjg.v17.i25.3002
Published online Jul 7, 2011. doi: 10.3748/wjg.v17.i25.3002
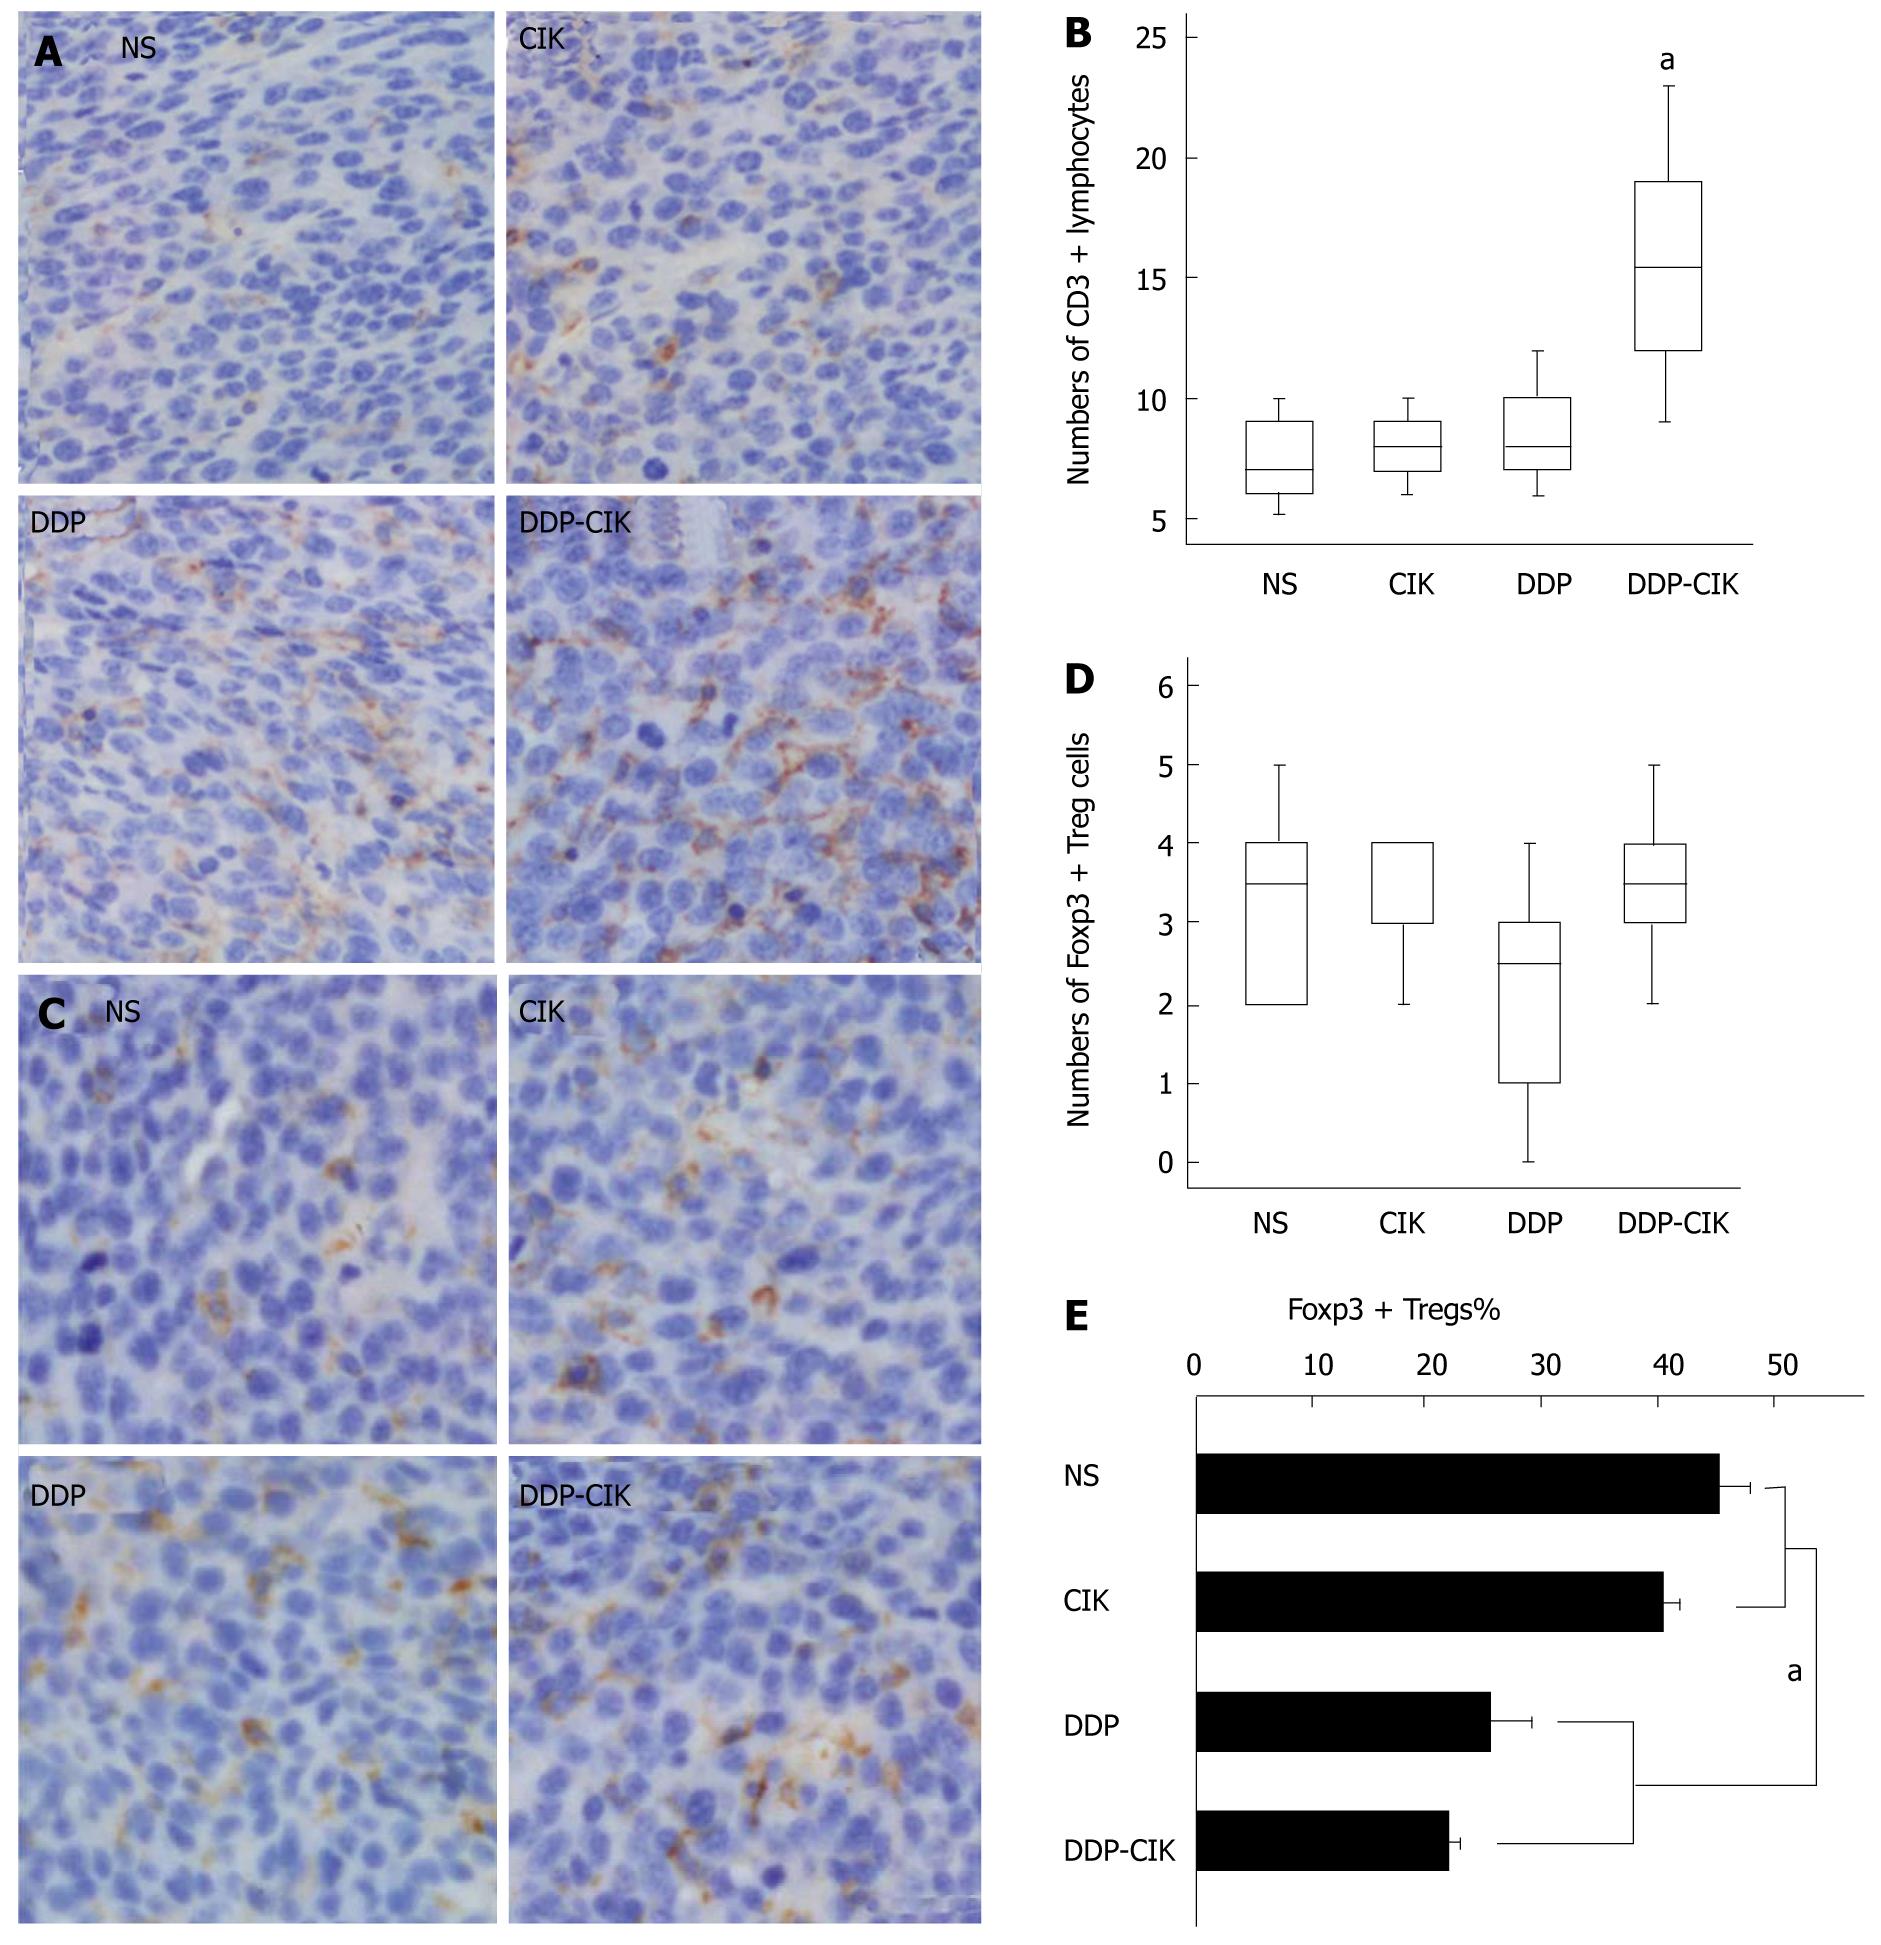
Figure 4 Intratumoral infiltration of lymphocytes after combined therapy.
BALB/c WT mice were injected s.c. with 1 × 10⁶ CT-26 cells and the treatment protocols were initiated 7 d later. On Day 19, consecutive tumor sections were prepared and analyzed by CD3 (A) and FoxP3 (C) staining. Ten individual fields (0.16 mm2) surrounding the apoptotic area (× 400 magnification) were chosen to count the number of intratumoral CD3+ T lymphocytes (B), and to determine the absolute number (D), and percentage (E) of FoxP3 + Treg cells. Experimental groups consisted of five mice per group. Representative sections from all groups are shown. Scale bar: 25 μm. Lines: median; Boxes:75% percentile; Bars (B, D) : SD. Columns : Mean Treg percentage; Bars (E): SE. aP < 0.05. NS: Normal saline; CIK: Cytokine-induced killer cells; DDP: Cisplatin.
- Citation: Huang X, Chen YT, Song HZ, Huang GC, Chen LB. Cisplatin pretreatment enhances anti-tumor activity of cytokine-induced killer cells. World J Gastroenterol 2011; 17(25): 3002-3011
- URL: https://www.wjgnet.com/1007-9327/full/v17/i25/3002.htm
- DOI: https://dx.doi.org/10.3748/wjg.v17.i25.3002


