
















©2011 Baishideng Publishing Group Co.
World J Gastroenterol. Jan 14, 2011; 17(2): 213-218
Published online Jan 14, 2011. doi: 10.3748/wjg.v17.i2.213
Published online Jan 14, 2011. doi: 10.3748/wjg.v17.i2.213
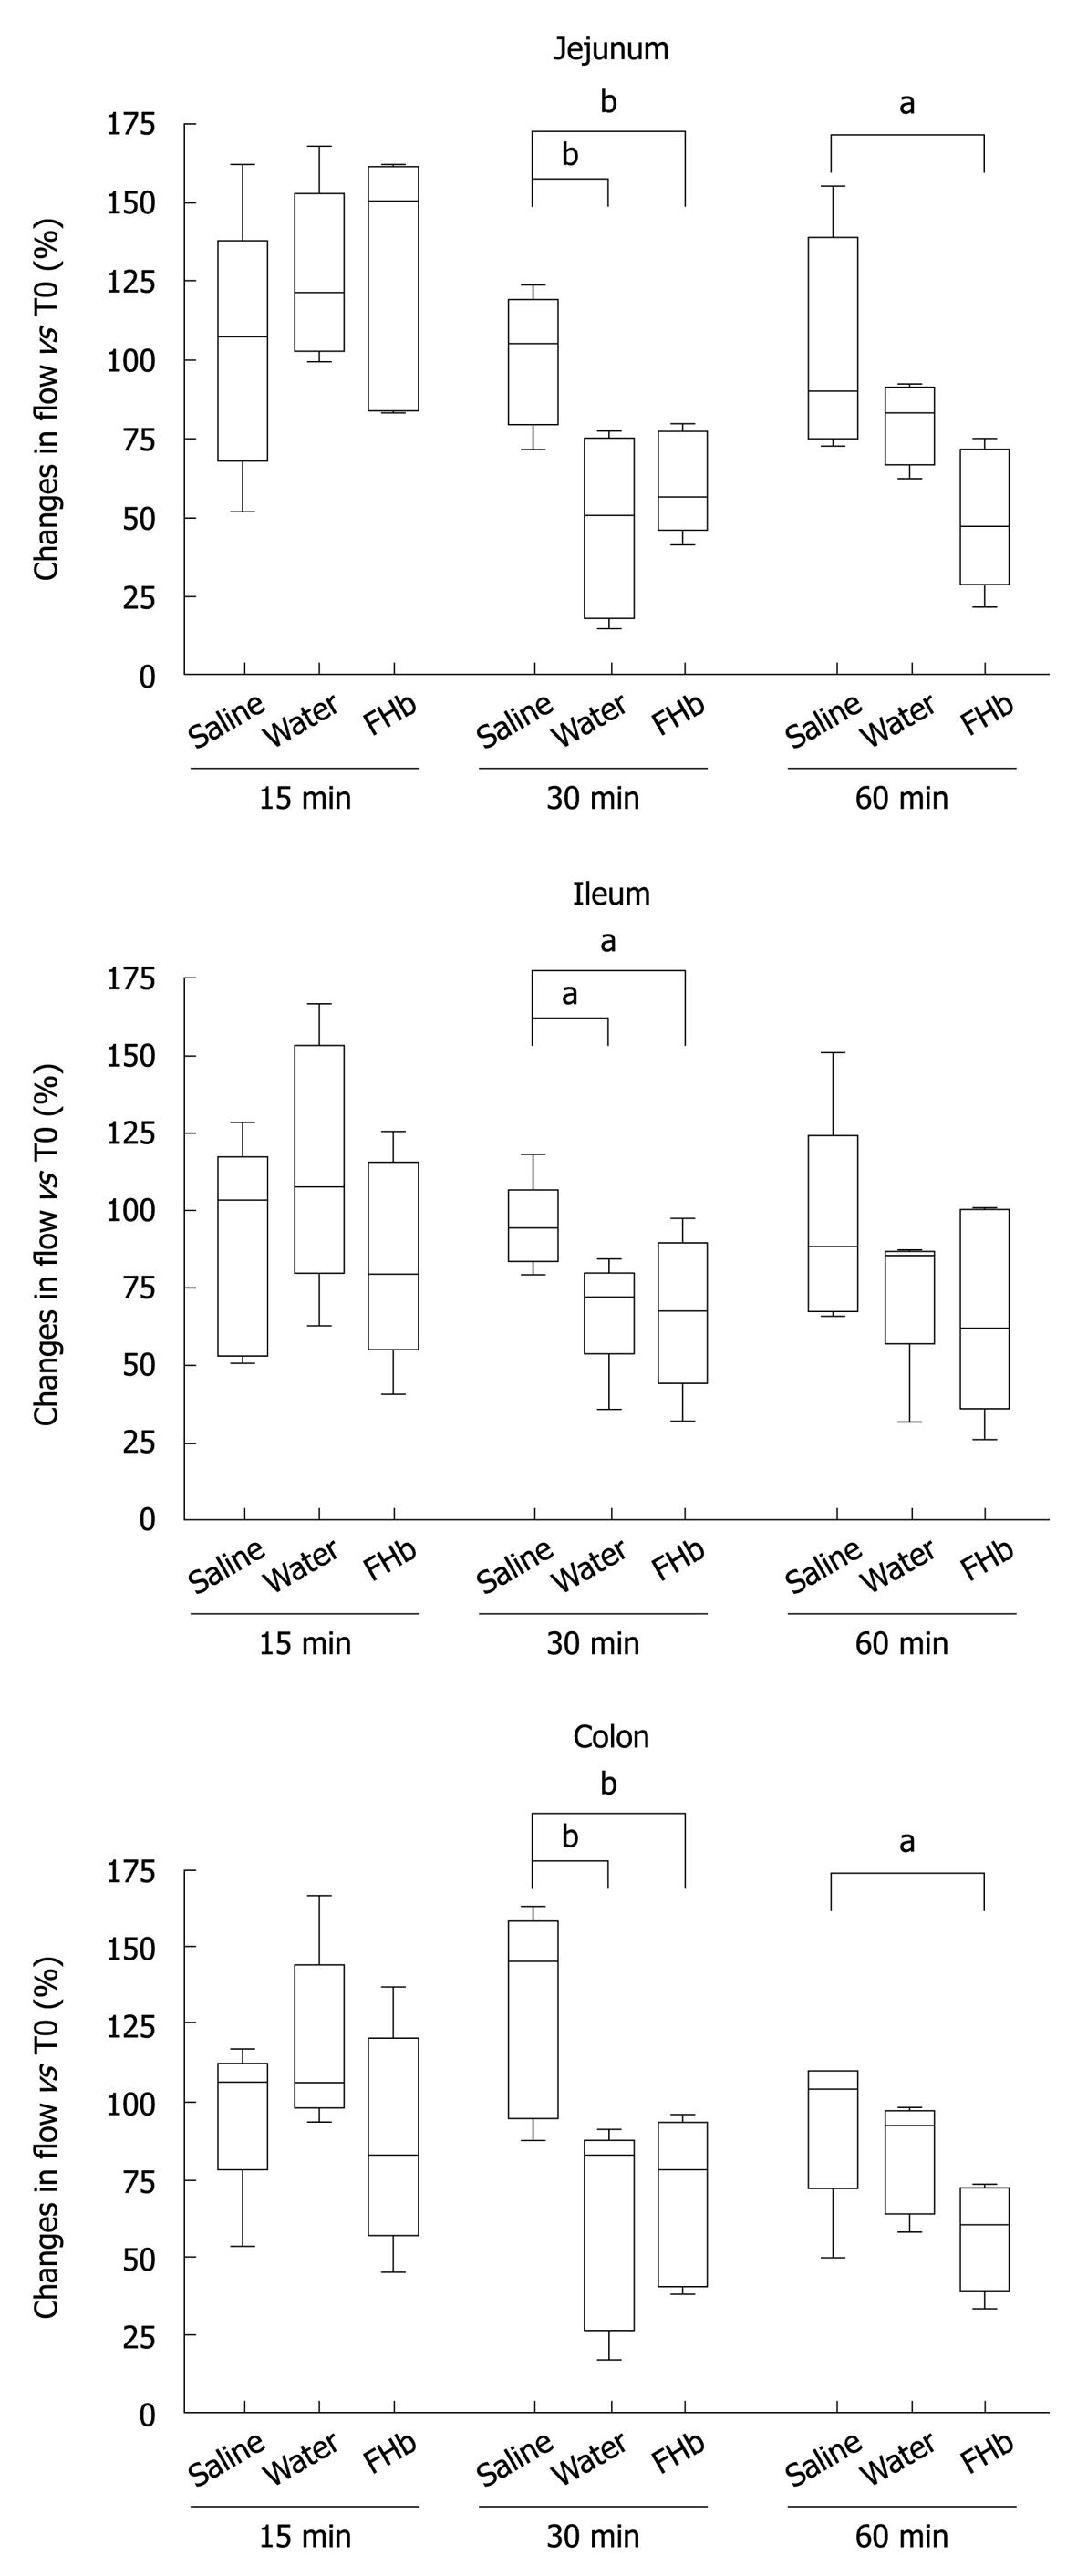
Figure 2 Decreased intestinal microcirculatory blood flow after water and free oxyhemoglobin infusion.
The gut was divided into three sections: jejunum, ileum and colon. Basal flow was set at 100% for all groups at T0. In both the water infusion group as well as in the free oxyhemoglobin (FHb) infusion group the microcirculation decreased. After infusion of saline, the microcirculatory blood flow remained around 100% throughout the study. Changes in time in microcirculatory blood flow are presented at T15, T30 and T60 and compared with the saline infusion group. aP < 0.05, bP < 0.01.
- Citation: Hanssen SJ, Lubbers T, Hodin CM, Prinzen FW, Buurman WA, Jacobs MJ. Hemolysis results in impaired intestinal microcirculation and intestinal epithelial cell injury. World J Gastroenterol 2011; 17(2): 213-218
- URL: https://www.wjgnet.com/1007-9327/full/v17/i2/213.htm
- DOI: https://dx.doi.org/10.3748/wjg.v17.i2.213