Copyright
©2011 Baishideng Publishing Group Co.
World J Gastroenterol. May 7, 2011; 17(17): 2181-2190
Published online May 7, 2011. doi: 10.3748/wjg.v17.i17.2181
Published online May 7, 2011. doi: 10.3748/wjg.v17.i17.2181
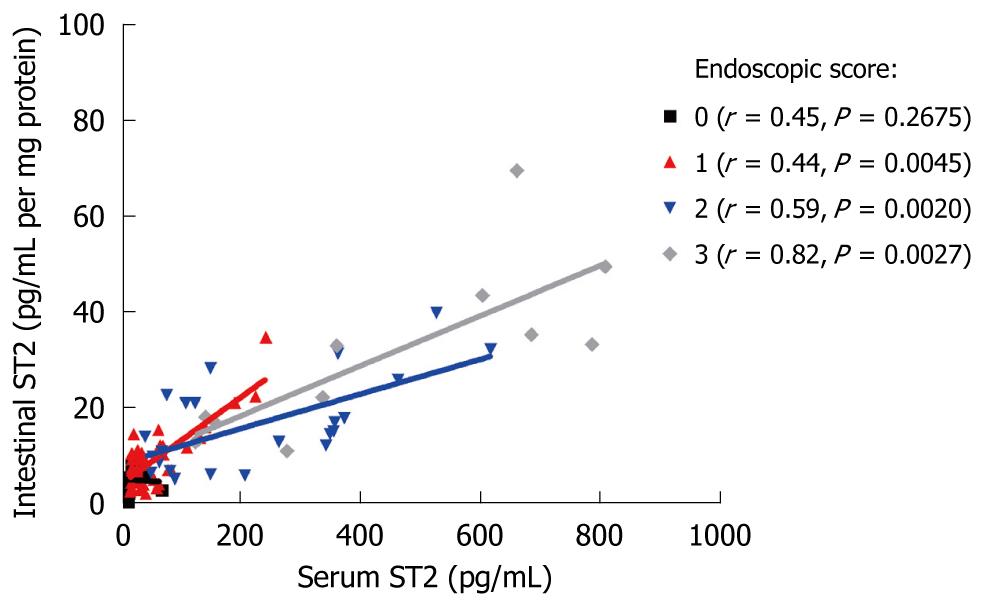
Figure 3 Graphic representation of the direct correlation between serum sST2 and total intestinal ST2 levels according to endoscopic activity scores.
Activity: 0 = inactive; 1 = mild; 2 = moderate; 3 = severe. The trend lines for each analyzed group are shown. r: Spearman’s rank correlation coefficient.
- Citation: Díaz-Jiménez D, Núñez LE, Beltrán CJ, Candia E, Suazo C, Álvarez-Lobos M, González MJ, Hermoso MA, Quera R. Soluble ST2: A new and promising activity marker in ulcerative colitis. World J Gastroenterol 2011; 17(17): 2181-2190
- URL: https://www.wjgnet.com/1007-9327/full/v17/i17/2181.htm
- DOI: https://dx.doi.org/10.3748/wjg.v17.i17.2181


