Copyright
©2011 Baishideng Publishing Group Co.
World J Gastroenterol. May 7, 2011; 17(17): 2181-2190
Published online May 7, 2011. doi: 10.3748/wjg.v17.i17.2181
Published online May 7, 2011. doi: 10.3748/wjg.v17.i17.2181
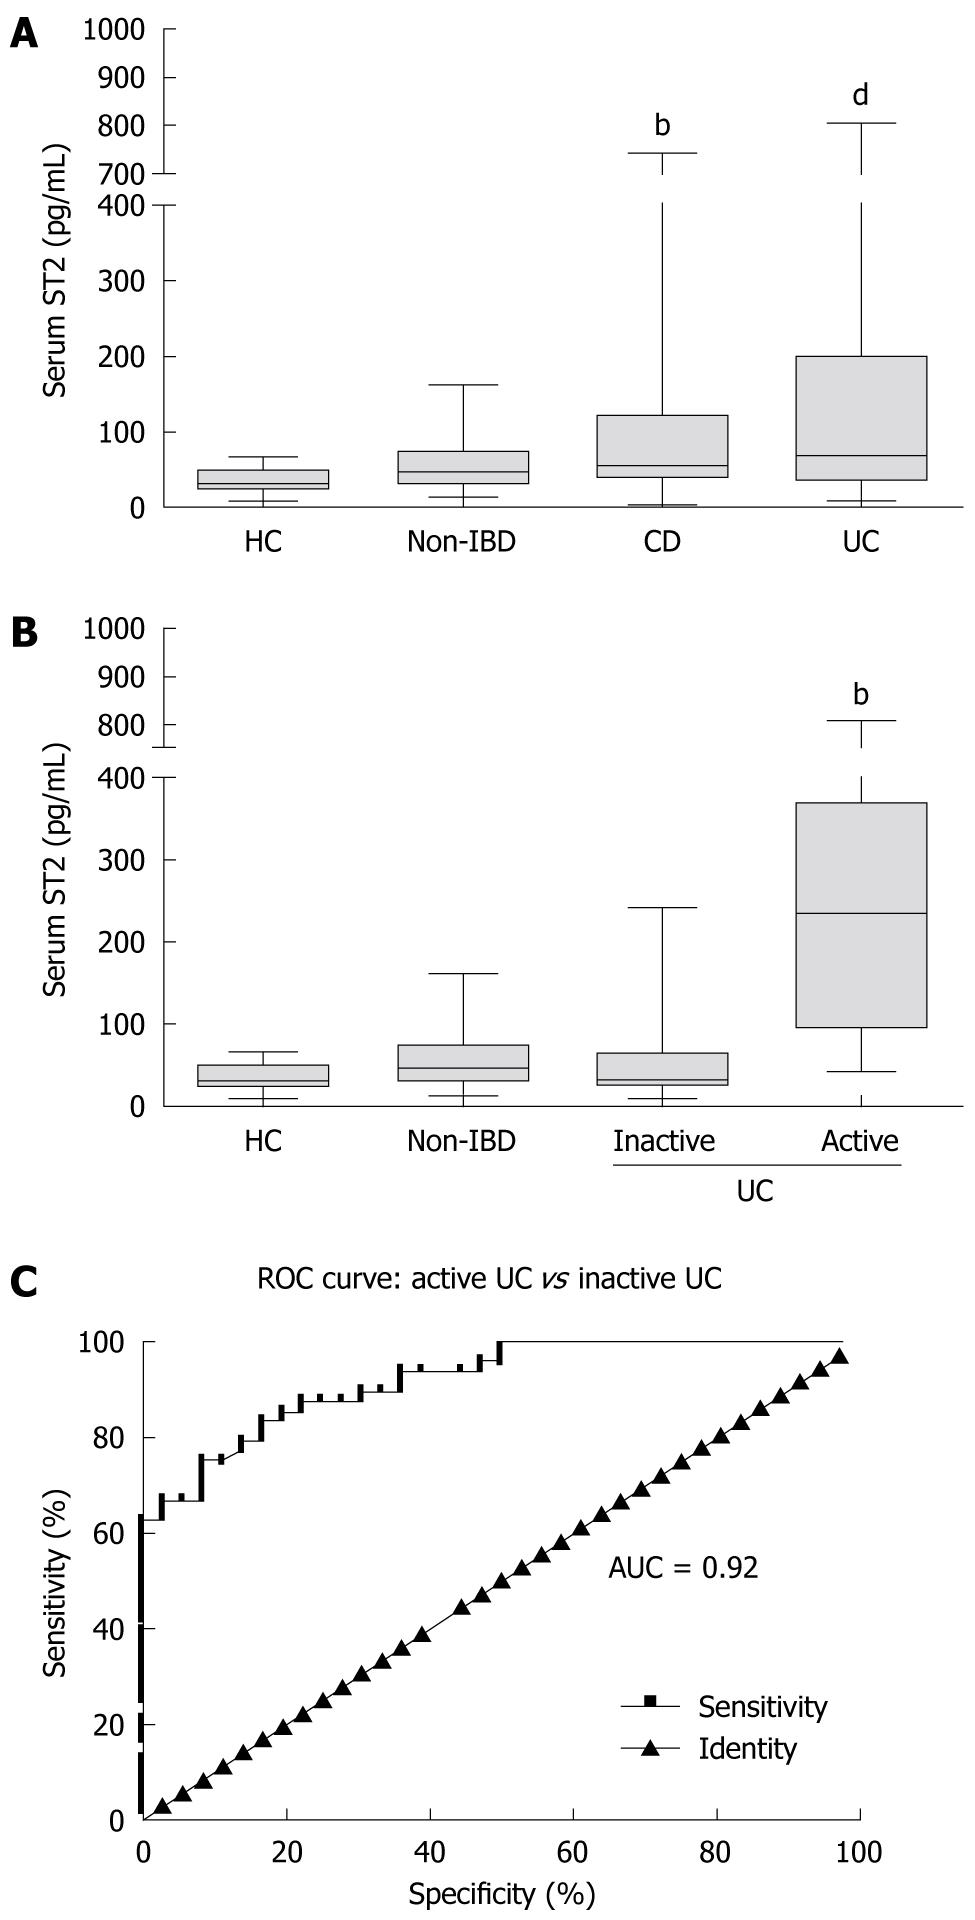
Figure 1 Distribution of serum levels of sST2 in the groups of studied patients.
Box-plot showing the distribution of serum sST2 levels in healthy patients (HC) compared to non-inflammatory bowel disease (IBD), Crohn’s disease (CD) and ulcerative colitis (UC) patients (A) and comparison of HC with non-IBD and inactive and active UC patients (B). Data are represented as median and percentiles (25th-75th) and significant differences in serum sST2 levels are shown between UC and CD patients vs HC (A) and between active UC and other groups (B). Receiver operating characteristics (ROC) curves for sST2 cut-off point determination (C). ROC curves illustrate the specificity and sensitivity in serum sST2 level determination to differentiate active from inactive UC. A: bP < 0.01, CD vs HC; dP < 0.001, UC vs HC; B: bP < 0.001, active UC vs HC, non-IBD and inactive UC.
- Citation: Díaz-Jiménez D, Núñez LE, Beltrán CJ, Candia E, Suazo C, Álvarez-Lobos M, González MJ, Hermoso MA, Quera R. Soluble ST2: A new and promising activity marker in ulcerative colitis. World J Gastroenterol 2011; 17(17): 2181-2190
- URL: https://www.wjgnet.com/1007-9327/full/v17/i17/2181.htm
- DOI: https://dx.doi.org/10.3748/wjg.v17.i17.2181


