Copyright
©2011 Baishideng Publishing Group Co.
World J Gastroenterol. Apr 28, 2011; 17(16): 2086-2095
Published online Apr 28, 2011. doi: 10.3748/wjg.v17.i16.2086
Published online Apr 28, 2011. doi: 10.3748/wjg.v17.i16.2086
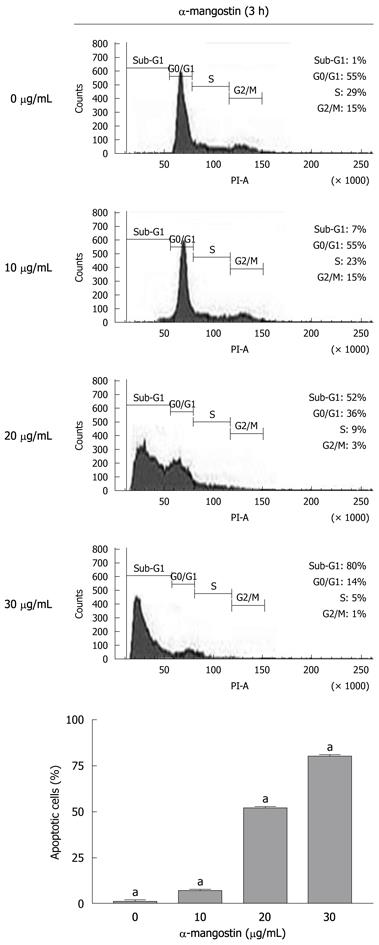
Figure 4 Flow analysis of cell cycle.
Representative plots of PI staining of COLO 205 cells that were treated with 0 (control), 10, 20 and 30 μg/mL α-mangostin for 3 h. The values are expressed as mean ± SD; aP < 0.05.
- Citation: Watanapokasin R, Jarinthanan F, Nakamura Y, Sawasjirakij N, Jaratrungtawee A, Suksamrarn S. Effects of α-mangostin on apoptosis induction of human colon cancer. World J Gastroenterol 2011; 17(16): 2086-2095
- URL: https://www.wjgnet.com/1007-9327/full/v17/i16/2086.htm
- DOI: https://dx.doi.org/10.3748/wjg.v17.i16.2086


