Copyright
©2011 Baishideng Publishing Group Co.
World J Gastroenterol. Apr 21, 2011; 17(15): 1947-1960
Published online Apr 21, 2011. doi: 10.3748/wjg.v17.i15.1947
Published online Apr 21, 2011. doi: 10.3748/wjg.v17.i15.1947
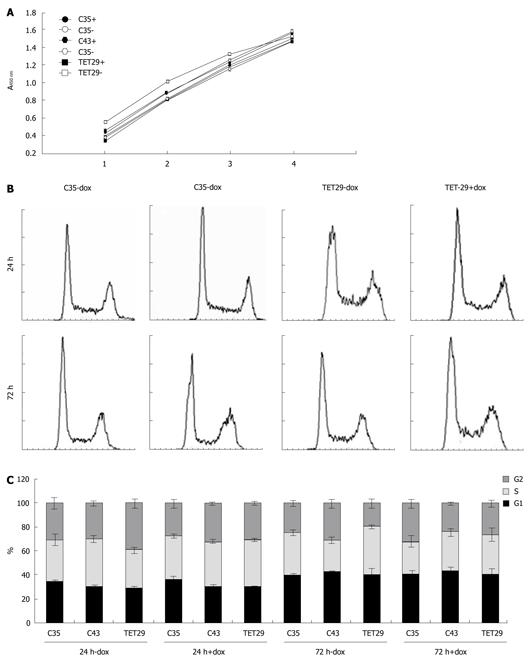
Figure 8 Cell proliferation (MTS-assay) (A) and cell cycle analysis (B) of doxycycline induced CapG overexpressing cells.
A: Sβtet29Cap35 (C35), Sβtet29Cap43 (C43) and the control Sβtet29 (TET29) cells were treated with 500 ng/mL doxycycline (+) or PBS as control (-) for 48 h. Mitochondrial activity was measured with the EZ4U assay and absorbance measured 1 h, 2 h, 3 h, and 4 h after substrate incubation. The experiment was performed three times with at least ten replicates; B: Sβtet29Cap35 (C35), Sβtet29Cap43 (C43) and the control Sβtet29 (TET29) cells were treated with 500 ng/ml doxycycline (+) or PBS as control (-) for 24 h and 72 h. The cells were propidium iodide stained and FACS analyzed. 10 000 cells were measured and the experiment was performed in triplicate with three replicates each. A representative chart for the cell cycle of C35 and TET29 cells is presented; C: The graphics represent the average percentage (± SE) of cells in G1, G2, and S phase in the different experimental conditions.
- Citation: Tonack S, Patel S, Jalali M, Nedjadi T, Jenkins RE, Goldring C, Neoptolemos J, Costello E. Tetracycline-inducible protein expression in pancreatic cancer cells: Effects of CapG overexpression. World J Gastroenterol 2011; 17(15): 1947-1960
- URL: https://www.wjgnet.com/1007-9327/full/v17/i15/1947.htm
- DOI: https://dx.doi.org/10.3748/wjg.v17.i15.1947


