Copyright
©2011 Baishideng Publishing Group Co.
World J Gastroenterol. Apr 21, 2011; 17(15): 1947-1960
Published online Apr 21, 2011. doi: 10.3748/wjg.v17.i15.1947
Published online Apr 21, 2011. doi: 10.3748/wjg.v17.i15.1947
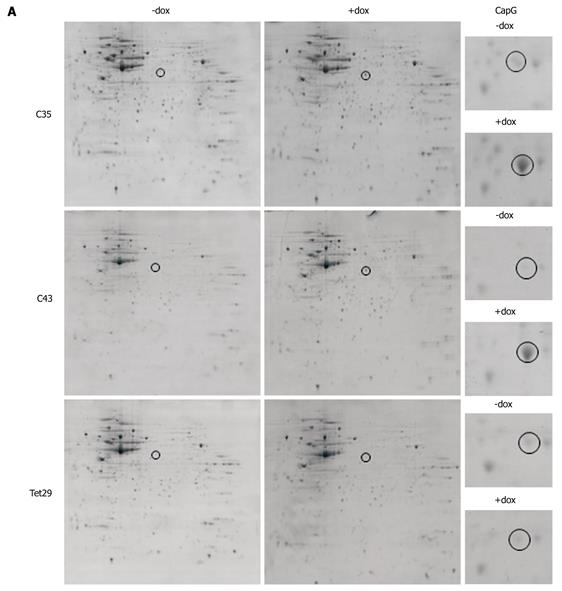
Figure 5 Two-dimensional gel analysis of stable inducible CapG overexpressing cells.
A: Colloidal Coomassie Blue stained gels displaying the proteome of Sβtet29Cap35 (C35), Sβtet29Cap43 (C43) and control Sβtet29 (TET29) cells. Cells were lysed in their uninduced state (- dox) and 18 h after treatment with 500 ng/mL doxycycline (+ dox). The area around the spot representing CapG (black circle) was magnified in the right hand column (CapG); B: The spot representing CapG was excised from the gels, trypsin digested, and analysed by Maldi-Tof. The sequence is shown and peptides identified by Maldi are bold and underlined.
- Citation: Tonack S, Patel S, Jalali M, Nedjadi T, Jenkins RE, Goldring C, Neoptolemos J, Costello E. Tetracycline-inducible protein expression in pancreatic cancer cells: Effects of CapG overexpression. World J Gastroenterol 2011; 17(15): 1947-1960
- URL: https://www.wjgnet.com/1007-9327/full/v17/i15/1947.htm
- DOI: https://dx.doi.org/10.3748/wjg.v17.i15.1947


