Copyright
©2011 Baishideng Publishing Group Co.
World J Gastroenterol. Apr 14, 2011; 17(14): 1903-1909
Published online Apr 14, 2011. doi: 10.3748/wjg.v17.i14.1903
Published online Apr 14, 2011. doi: 10.3748/wjg.v17.i14.1903
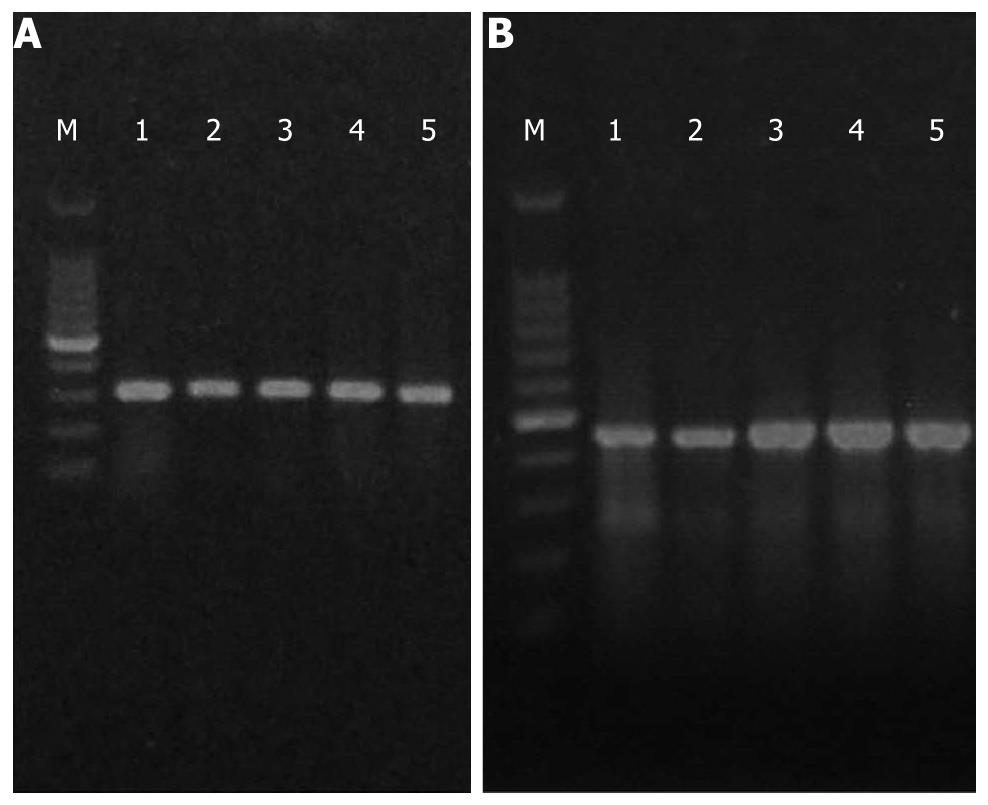
Figure 3 Electrophoretograms of tumor necrosis factor-α (A) and IL-6 (B).
M: Marker; lane 1: Normal control group; lane 2: Untreated group; lane 3: Low-dose salvianolate-treated group; lane 4: Medium-dose salvianolate-treated group; lane 5: High-dose salvianolate-treated group.
- Citation: Yang DH, Ye ZY, Jin B, He XJ, Zhang Q, Zhou WM, Xu WJ, Lu HX. Salvianolate inhibits cytokine gene expression in small intestine of cirrhotic rats. World J Gastroenterol 2011; 17(14): 1903-1909
- URL: https://www.wjgnet.com/1007-9327/full/v17/i14/1903.htm
- DOI: https://dx.doi.org/10.3748/wjg.v17.i14.1903


