Copyright
©2010 Baishideng.
World J Gastroenterol. Mar 7, 2010; 16(9): 1086-1092
Published online Mar 7, 2010. doi: 10.3748/wjg.v16.i9.1086
Published online Mar 7, 2010. doi: 10.3748/wjg.v16.i9.1086
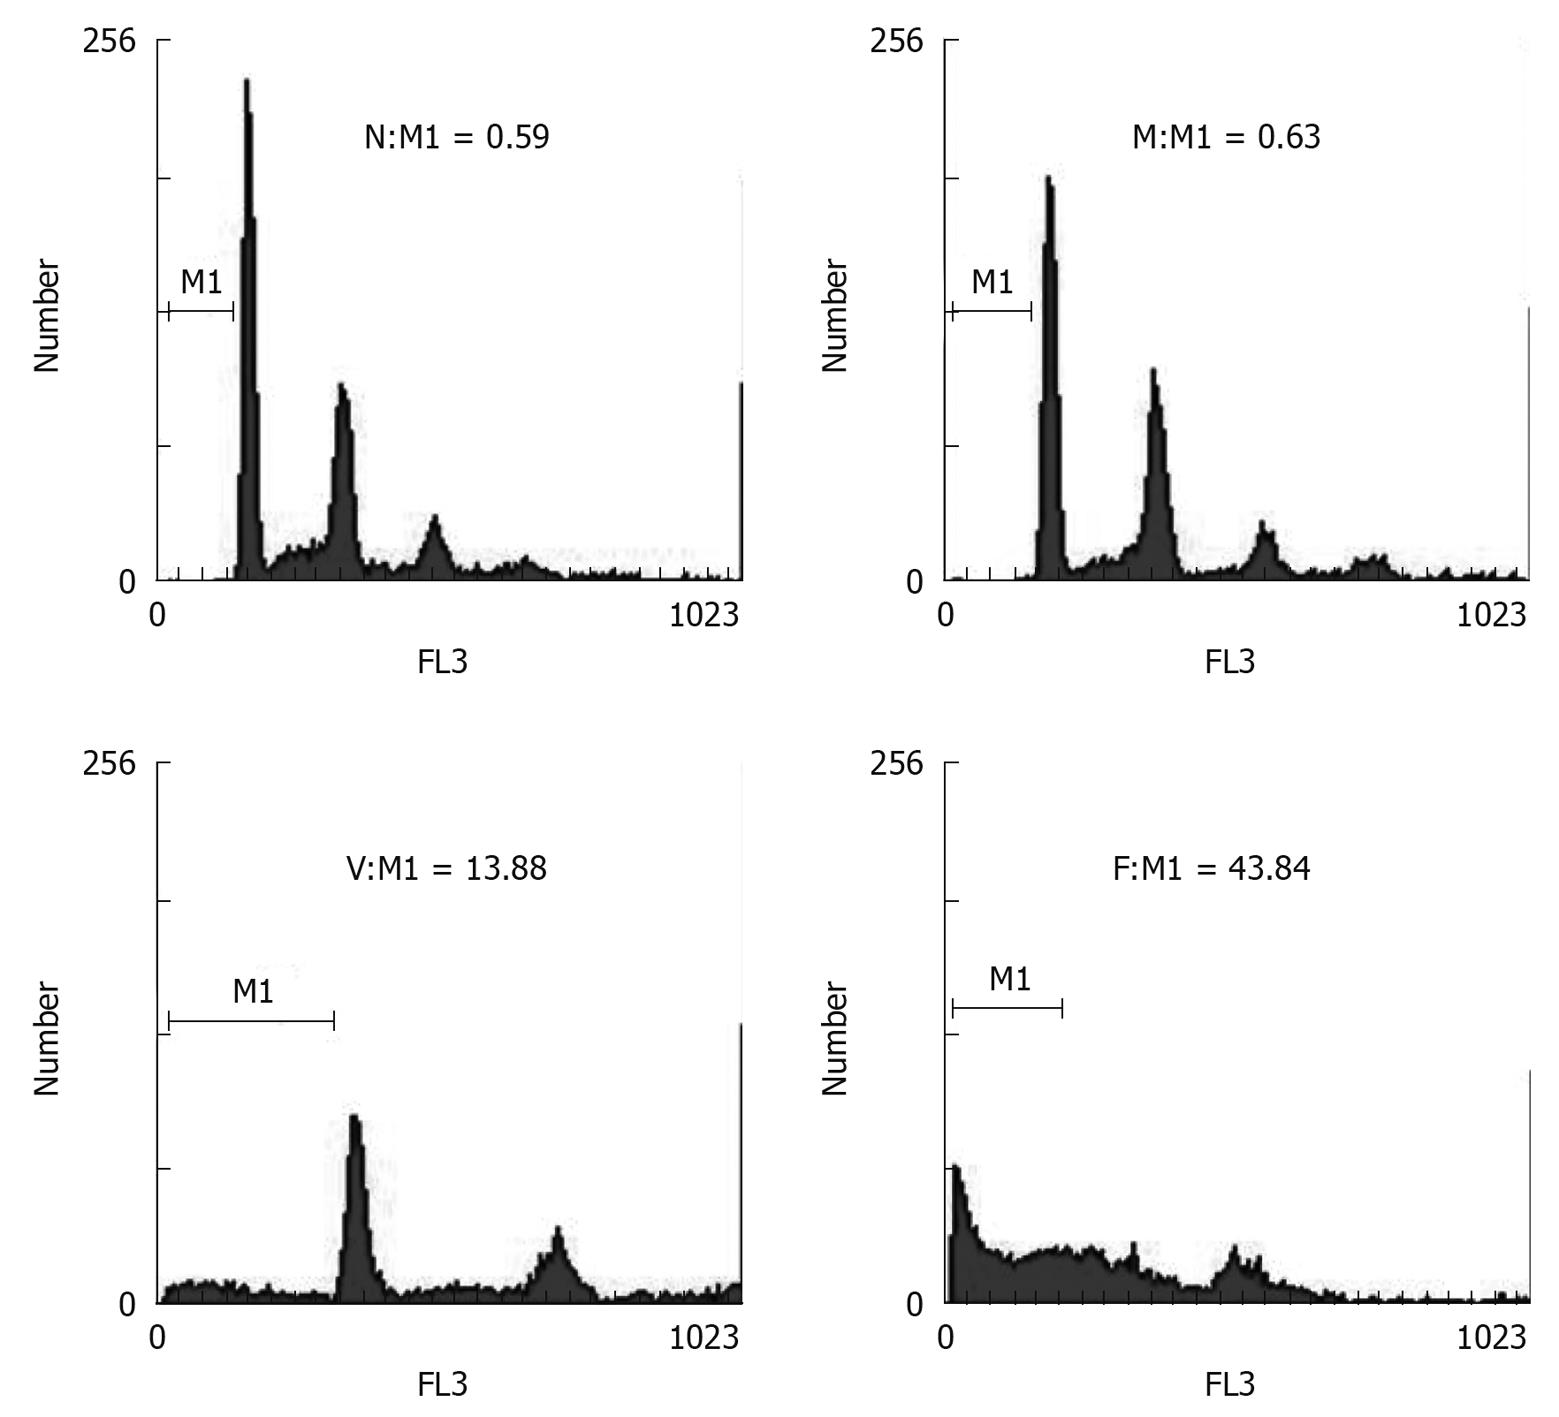
Figure 4 Apoptosis of HCT116 cells measured by flow cytometry (FCM).
The percentage of the pre-G0-G1 population (peak) is shown for each histogram. The peak indicates the apoptosis rate of the cells. N: Normal control group; M: Mismatched group; V: VEGF-siRNA group; F: 5-FU group.
- Citation: Yin Y, Cao LY, Wu WQ, Li H, Jiang Y, Zhang HF. Blocking effects of siRNA on VEGF expression in human colorectal cancer cells. World J Gastroenterol 2010; 16(9): 1086-1092
- URL: https://www.wjgnet.com/1007-9327/full/v16/i9/1086.htm
- DOI: https://dx.doi.org/10.3748/wjg.v16.i9.1086


