Published online Mar 7, 2010. doi: 10.3748/wjg.v16.i9.1043
Revised: December 5, 2009
Accepted: December 12, 2009
Published online: March 7, 2010
i-scan technology is the newly developed image-enhanced endoscopy technology from PENTAX, Japan. This consists of three types of algorithms: surface enhancement (SE), contrast enhancement (CE), and tone enhancement (TE). SE enhances light-dark contrast by obtaining luminance intensity data for each pixel and applying an algorithm that allows detailed observation of a mucosal surface structure. CE digitally adds blue color in relatively dark areas, by obtaining luminance intensity data for each pixel and applying an algorithm that allows detailed observation of subtle irregularities around the surface. Both enhancement functions work in real time without impairing the original color of the organ, therefore, SE and CE are suitable for screening endoscopy to detect gastrointestinal tumors at an early stage. TE dissects and analyzes the individual RGB components of a normal image. The algorithm then alters the color frequencies of each component and recombines the components to a single, new color image. This is designed to enhance minute mucosal structures and subtle changes in color. TE works in real time and consists of three modes such as TE-g for gastric tumors, TE-c for colonic tumors, and TE-e for esophageal tumors. TE is suitable mainly for detailed examination of the lesions that are detected in a screening endoscopy. i-scan technology leads us to easier detection, diagnosis and treatment of gastrointestinal diseases.
- Citation: Kodashima S, Fujishiro M. Novel image-enhanced endoscopy with i-scan technology. World J Gastroenterol 2010; 16(9): 1043-1049
- URL: https://www.wjgnet.com/1007-9327/full/v16/i9/1043.htm
- DOI: https://dx.doi.org/10.3748/wjg.v16.i9.1043
Following recent advances in endoscopic treatment of gastrointestinal tumors, early detection and accurate diagnosis of tumors have been increasing in importance. Under such circumstances, a new endoscopic image enhancement technology i-scan has been developed by PENTAX (HOYA Corporation), Japan. This paper describes the features of this i-scan technology, and shows actual images.
i-scan technology is classified as a digital contrast method among endoscopic imaging techniques[1]. i-scan has three modes of image enhancement, i.e. surface enhancement (SE; enhancement of the structure through recognition of the edges); contrast enhancement (CE; enhancement of depressed areas and differences in structure through colored presentation of low density areas); and tone enhancement (TE; enhancement tailored to individual organs through modification of the combination of RGB components for each pixel). For SE and CE, switching among three enhancement levels (low, medium and high) is possible. For TE, switching among three objects (esophagus, stomach and colon) is possible. The three modes (SE, CE and TE) are arranged in series, therefore, it is possible to apply two or more of these three modes at one time. Switching the levels or modes of enhancements can be done on a real-time basis, without any time lag by pushing a relevant button, thus enabling efficient endoscopic observation.
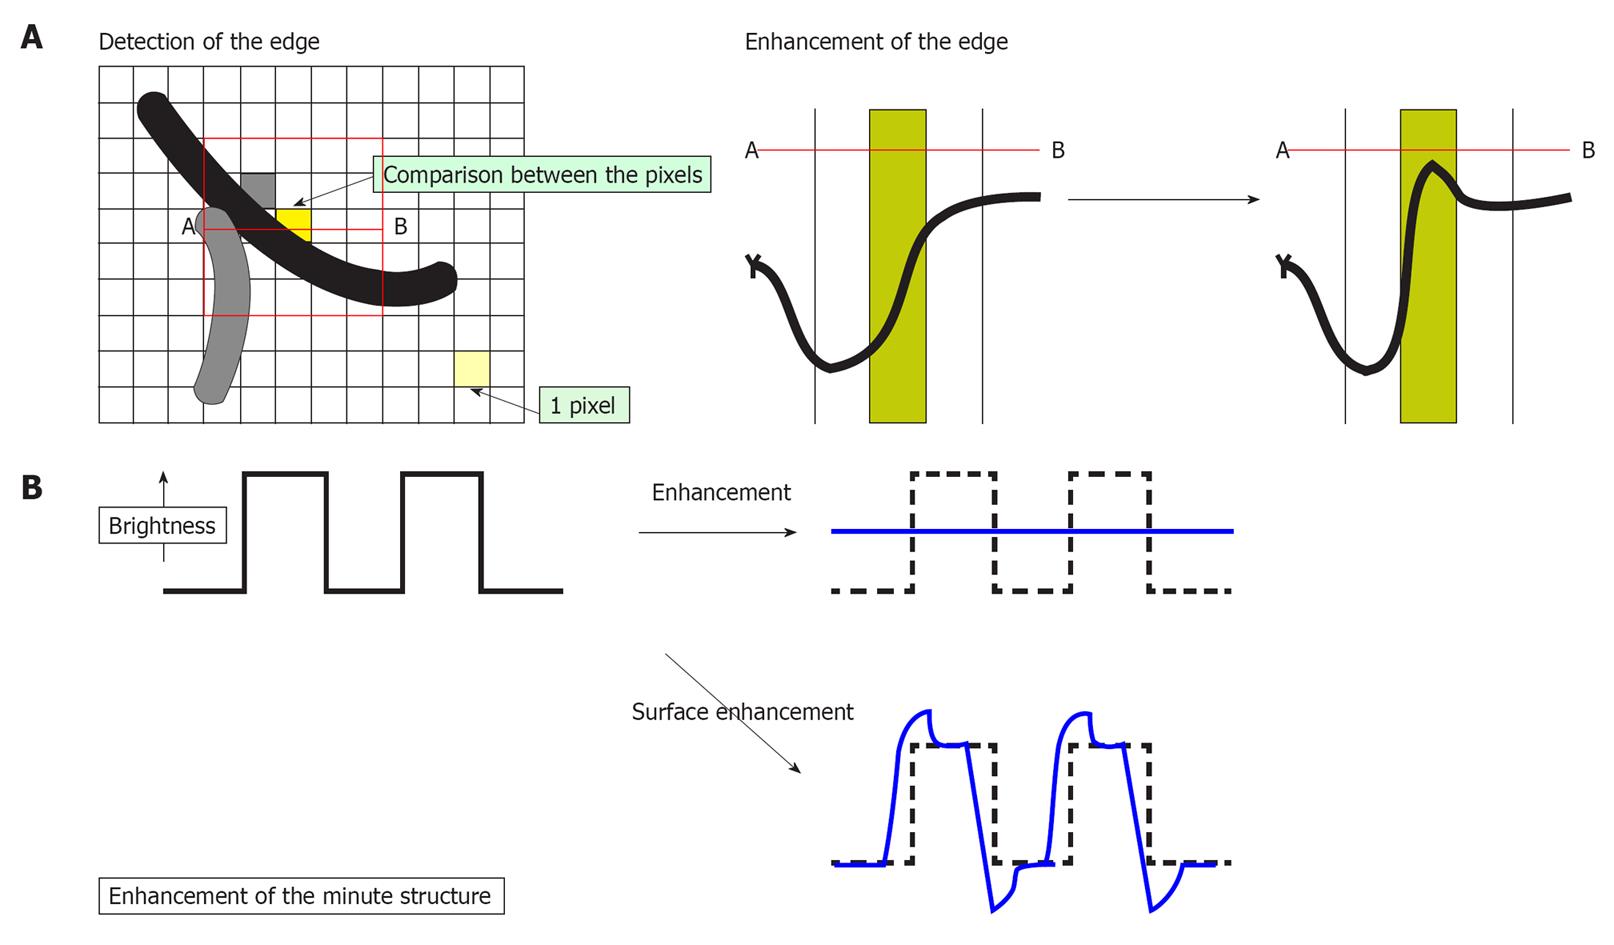
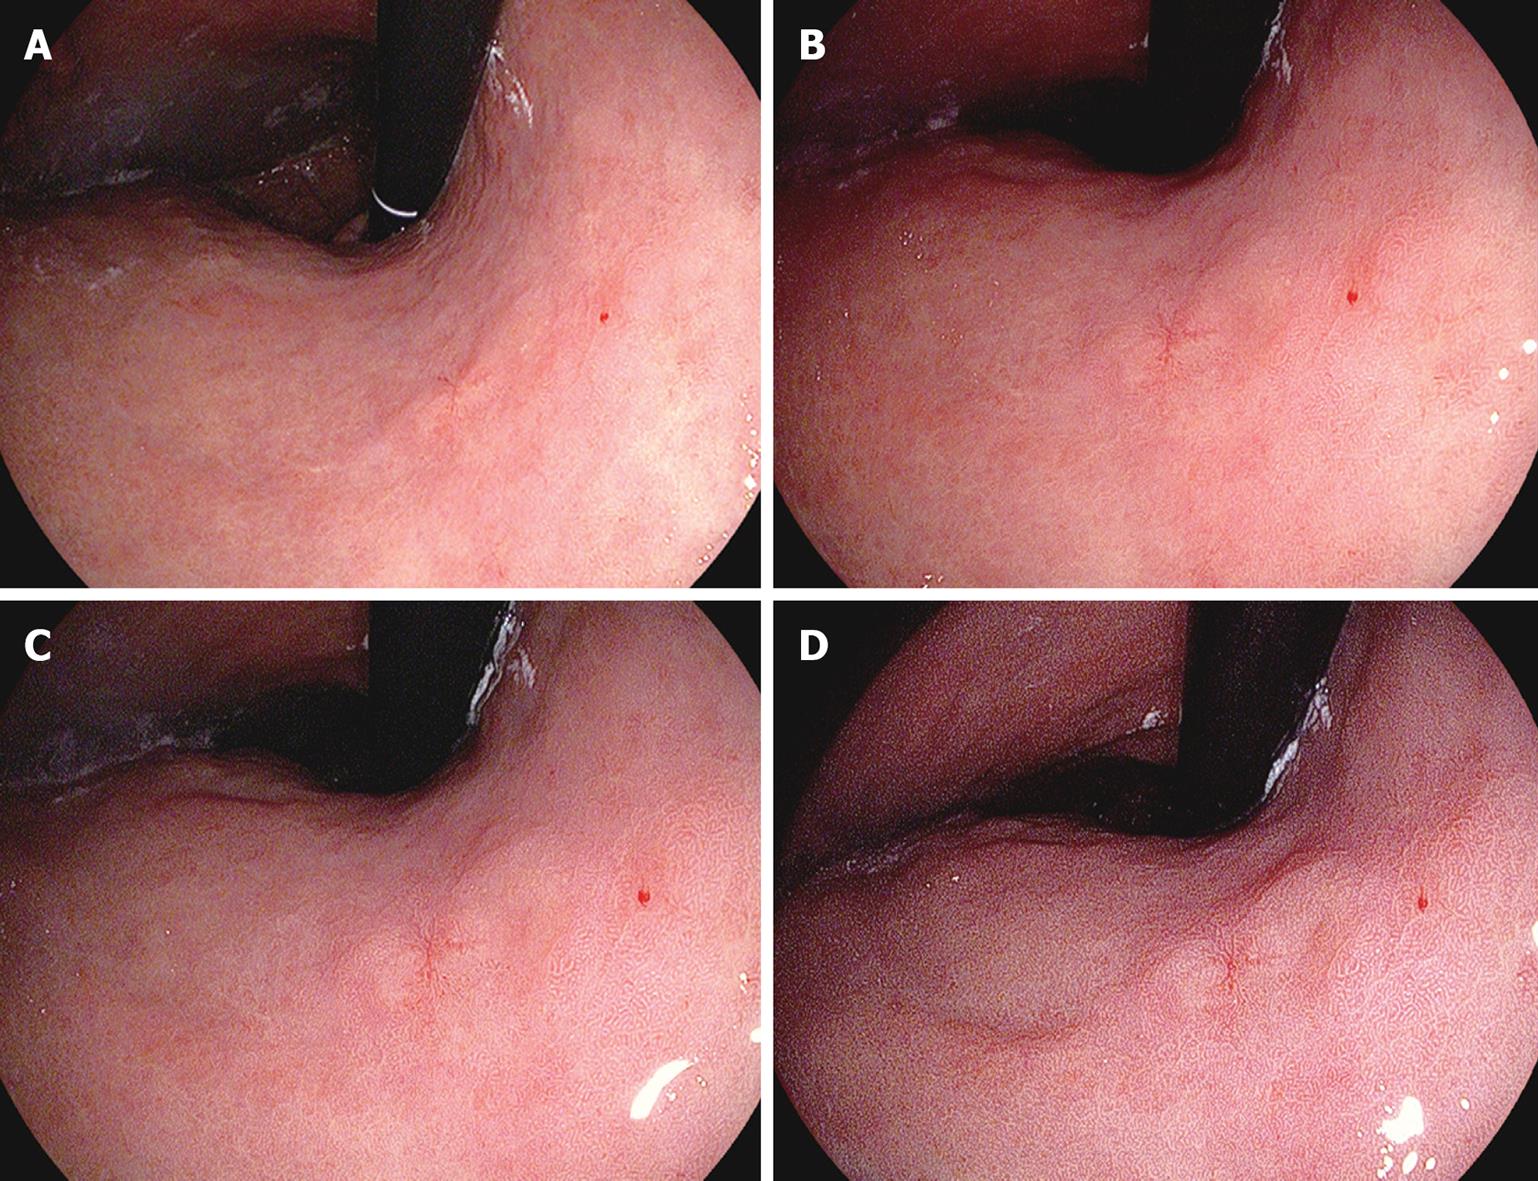
With SE, the difference in luminance intensity between the pixels concerned and the surrounding pixels is analyzed and the edge components are enhanced (Figure 1A). With ordinary enhancement, minor changes in structure are perceived as noise, and the area that shows such changes is smoothed out. With SE, on the other hand, adjustment of the noise erasure function allows more evident enhancement of the edges, which corresponds to minor changes in structure (Figure 1B). As compared to normal images, SE images do not differ in brightness and differ little in color. Furthermore, SE allows more extensive observation of minute glandular structures, which makes it easier to check changes on the basis of structural differences (Figure 2A and B).
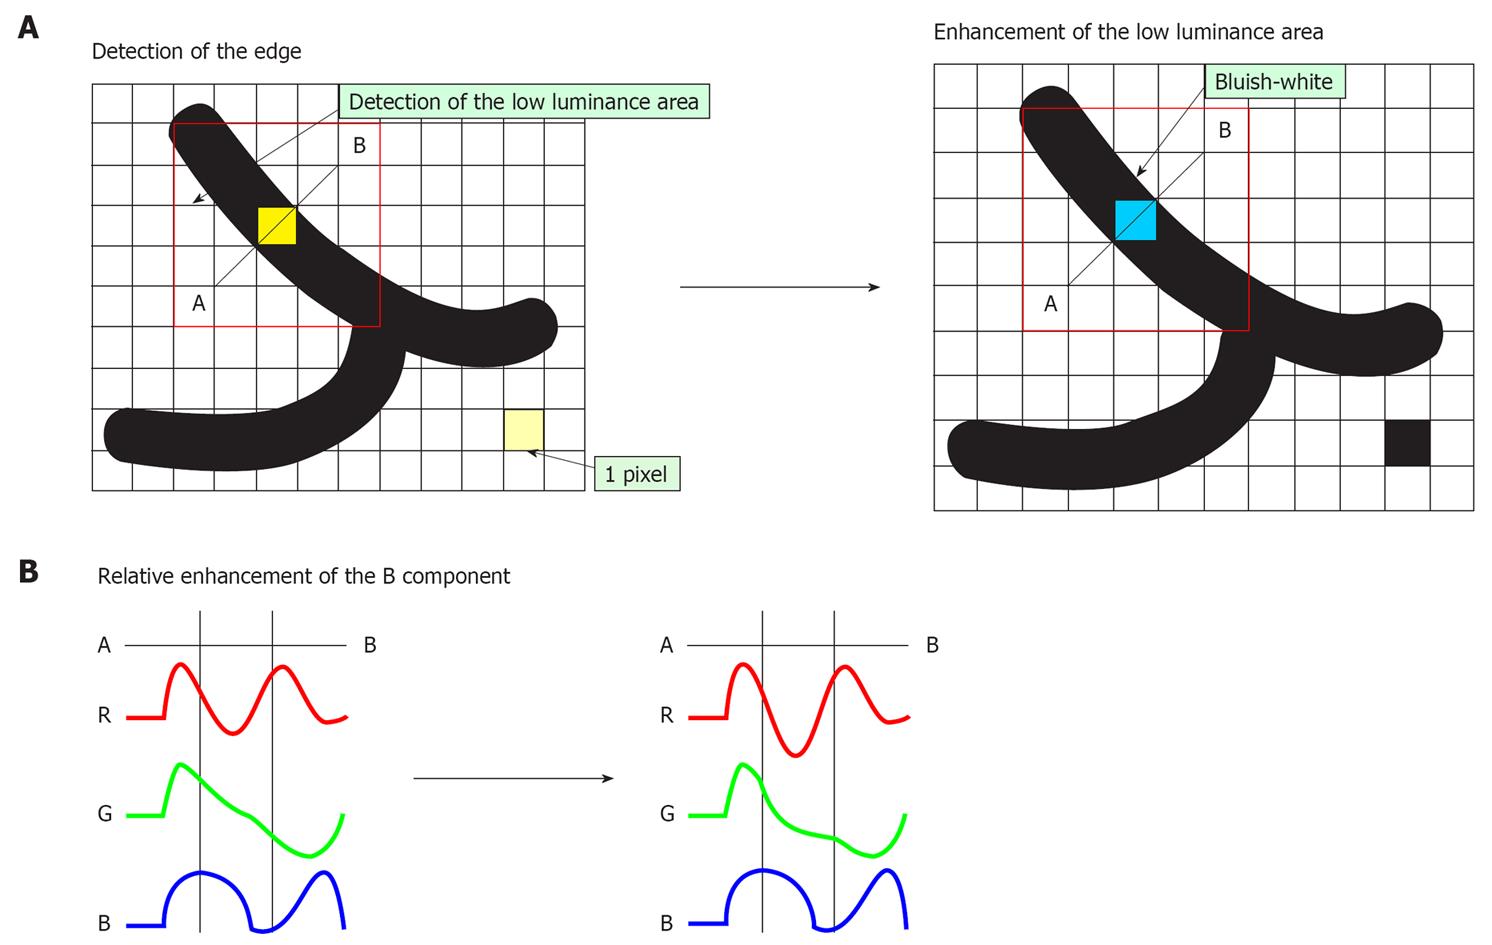
With CE, areas lower in luminance intensity compared to surrounding pixels are identified on the basis of pixel-wise luminance intensity data, followed by relative enhancement of the B component through the slight suppression of R and G components in this low luminance area (Figure 3A and B). As a result of CE, the low luminance area is stained slightly bluish white and minute irregularities on the mucosal surface are enhanced. Even in the case of flat mucosa, the minute glandular structure can be enhanced because the color is changed, which reflects very minute depressions at the gland duct opening. Processing of images with CE does not cause a change in image brightness or a marked change in the color of the images. It causes only slight bluish-white staining of depressed areas (Figure 2C).
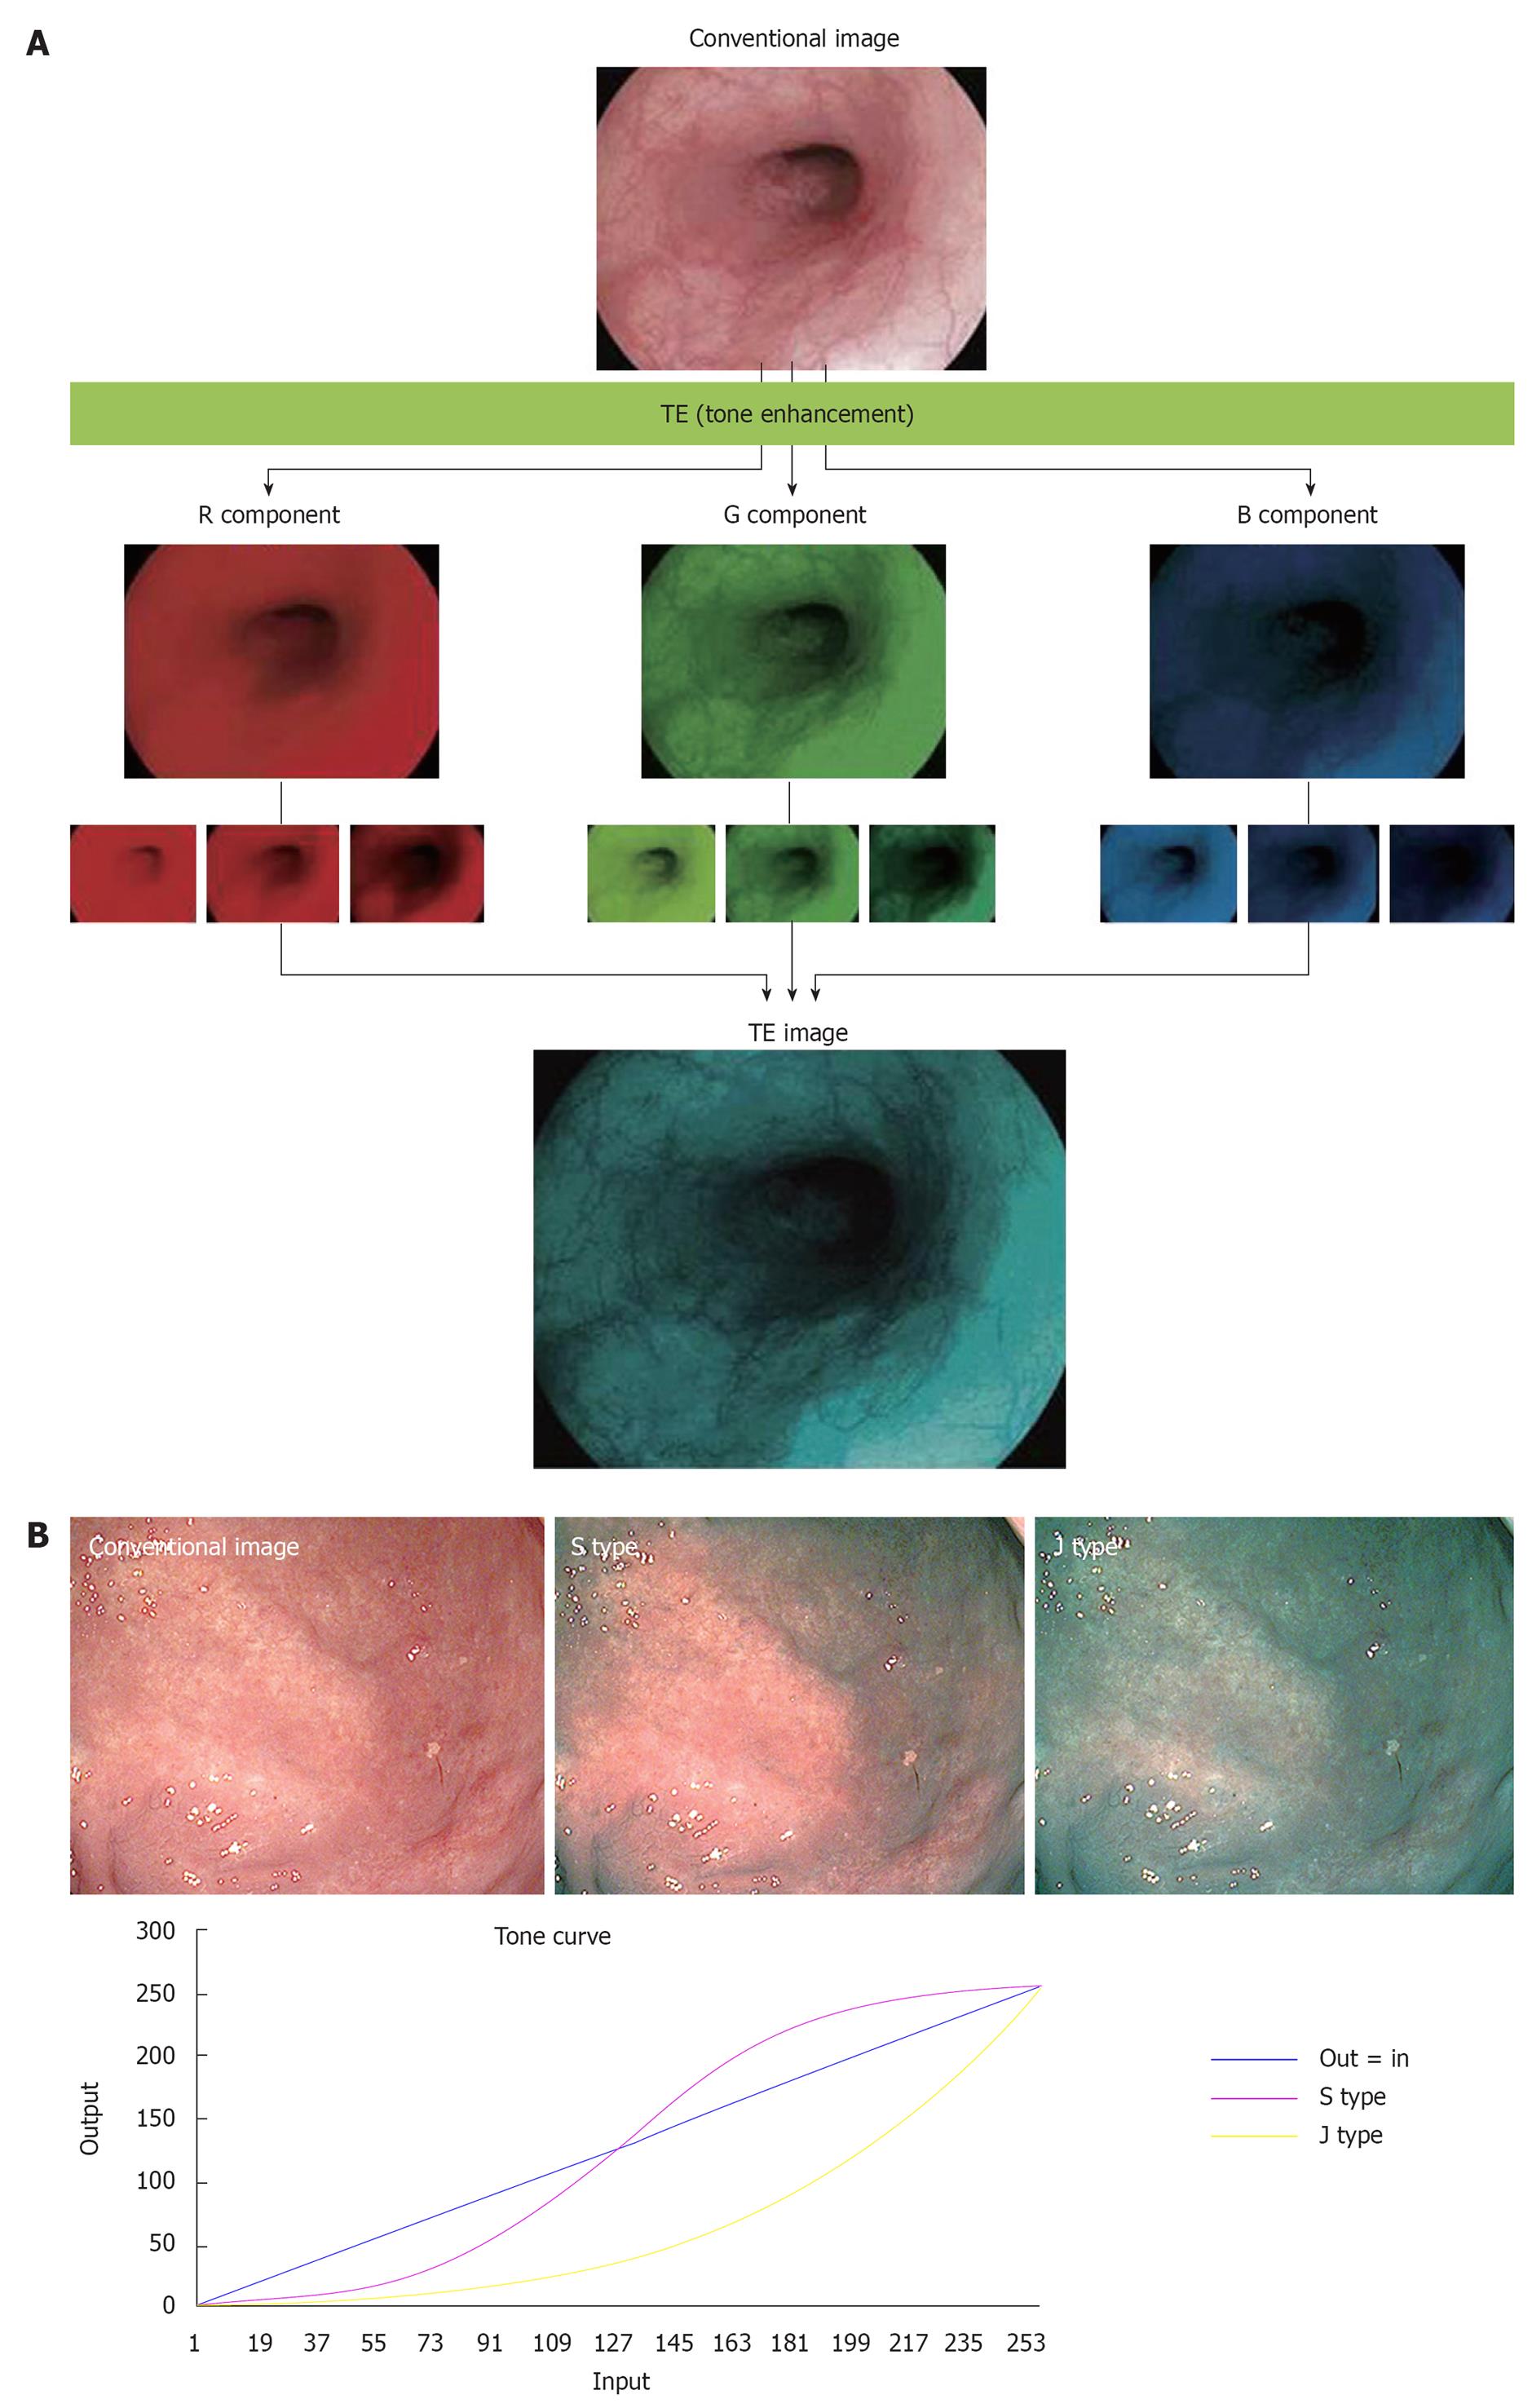
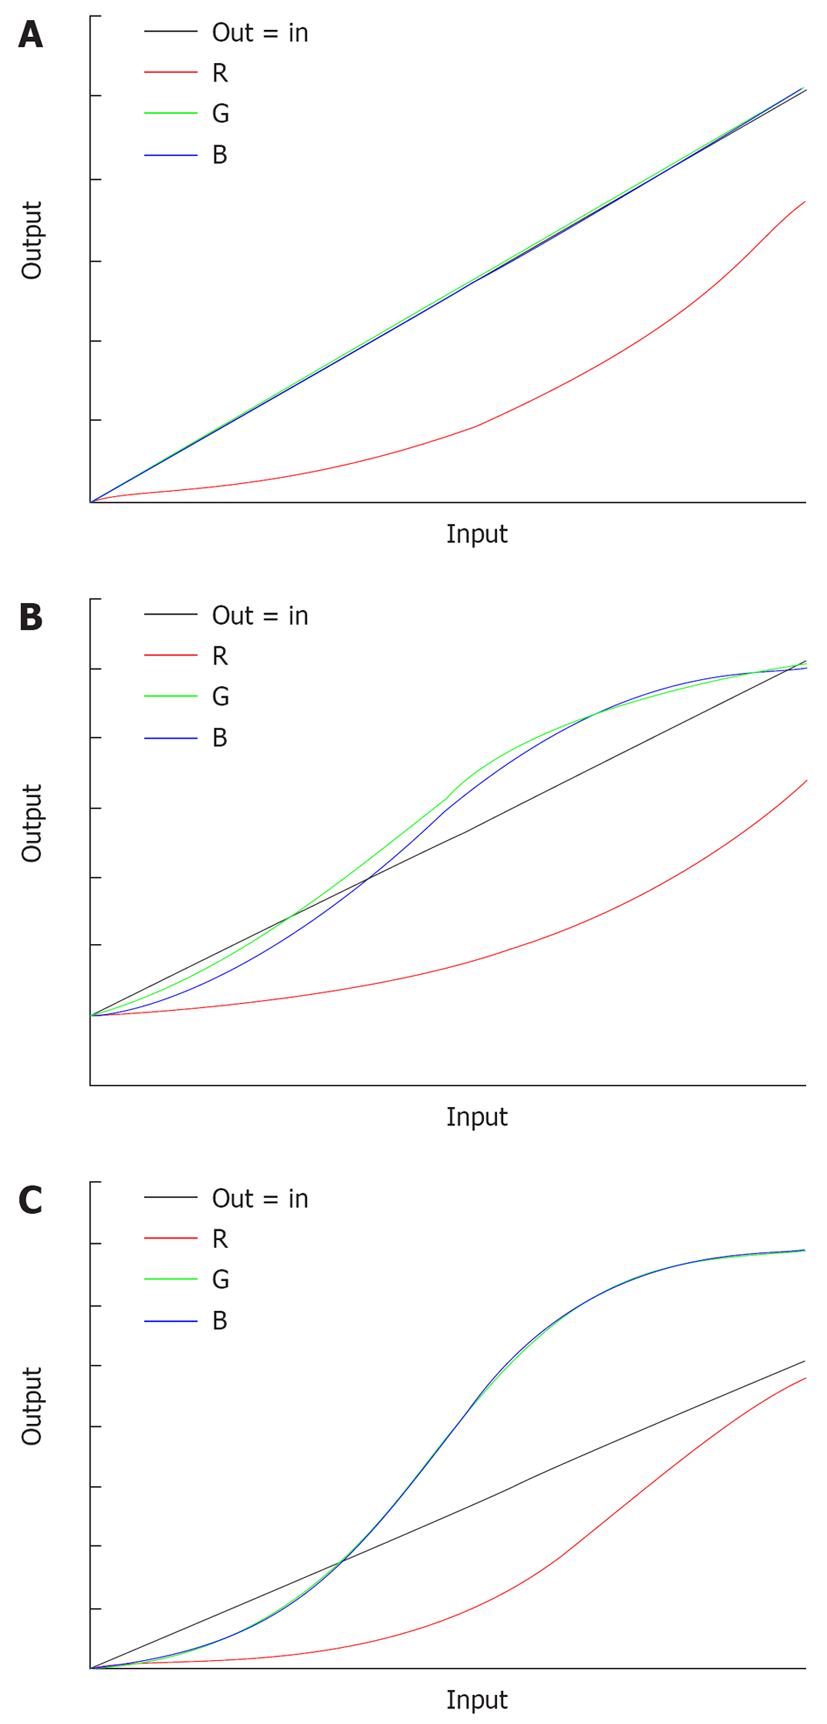
With conventional endoscopy, the white reflective rays from the mucosa are caught by the CCD at the tip of the endoscope and are displayed on the monitor. With TE, on the other hand, the RGB components of an ordinary endoscope image are disintegrated into each component (R, G and B), and each component thus isolated is converted independently along the tone curve, followed by a re-synthesis of the three components to yield a reconstructed image (Figure 4A). The tone curve is depicted by plotting input (on the x axis) against output (on the y axis) (Figure 4B). The tone curve can be changed into various forms by modification of the parameters. The tone-curve forms can be divided roughly into S and J types. Figure 4B is an image yielded from modification of the R component alone; this example clearly shows how the image changes as the tone curve is switched from S to J type or vice versa. If the tone curve assumes an S type, the high R-component area is shifted to a further higher range of R to enhance the color tone R, or the low R-component area is shifted to a further lower range of R to elevate the sensitivity to GB components, thus allowing clear enhancement of the differences in color tone. If the tone curve assumes a J-type form, the R component is shifted completely to a low R range, to elevate the overall sensitivity to GB components and the brightness/darkness contrast. At present, three types of TE are available, including TE-e (for esophagus), TE-g (for stomach) and TE-c (for intestines). With TE-e, the J-type tone curve, which suppresses the maximum output, is adopted for the R component, to elevate G/B contrast and make structural changes clearer (Figure 5A). With TE-g, the J-type tone curve, which suppresses the maximum output, is adopted for the R component to elevate the G/B contrast, and the S-type tone curve is adopted for G and B components to elevate color contrast. In this way, TE-g yields images that allow easy identification of a lesion because it can increase the contrast for even minor differences in color tone (Figure 5B). With TE-c, the J-type tone curve is adopted for the R component, but the output is higher than that with TE-g, which results in a slightly reddish image. The S-type tone curve is adopted for the G and B components with TE-g, and the output is set higher to allow a more evident depiction of the structure of the gland opening in the medium to high range (Figure 5C).
SE and CE are expected to provide a useful means of screening because they can improve discernment of lesions without altering the color tone markedly and reducing the brightness of images. At our hospital, SE and CE are applied at the same time. Noise increases as enhancement becomes more intense, therefore, we usually apply the lowest levels of SE (low) + CE (low) (Figure 2D). After a lesion is found, TE is applied as a simple means of making changes in the color tone and structure more evident. If the structure or irregularities need to be further enhanced during TE, the level of SE and CE is elevated. TE can be effected quite simply and instantaneously by pushing the button. It may be used to assess the necessity of more detailed testing by means of dye spraying, magnified observation, or biopsy.
Narrow band imaging (NBI) is an endoscopic imaging technique that emphasizes the mucosal microvasculature and identifies vascular alterations, by placing narrow bandpass filters in front of a conventional white-light source to obtain tissue illumination at selected, narrow wavelength bands[2,3]. Although NBI is useful for detecting and diagnosing early esophageal cancers with[4] or without magnifying endoscopy[5], and identifying the demarcation line and predicting the histological characteristics of gastric cancers with magnifying endoscopy[6-8], narrow band images are much darker than conventional white-light images, particularly in large luminal diameter regions of the gastrointestinal tract. i-scan images are as bright as conventional white-light images, therefore, i-scan is able to observe much larger areas in a distant view compared with NBI. Moreover, i-scan does not need magnifying endoscopy to observe the demarcation of the lesion. Consequently, i-scan might be more useful for performing screening endoscopy and diagnosing the extent of a lesion, particularly that of a large superficial lesion in the stomach.
On the other hand, chromoendoscopy came into clinical use 40 years ago as a method of identifying lesions and observing them in detail[9]. In particular, indigo carmine is the dye most frequently used for chromoendoscopy in Japan. Although this method is useful for recognizing a lesion and diagnosing the margin of a lesion more easily than conventional endoscopic observation[10,11], it may not be time consuming. i-scan can be effected quite simply and instantaneously by pushing a button, therefore, it is an easy method for screening or detailed inspection, and may reduce both time and costs.
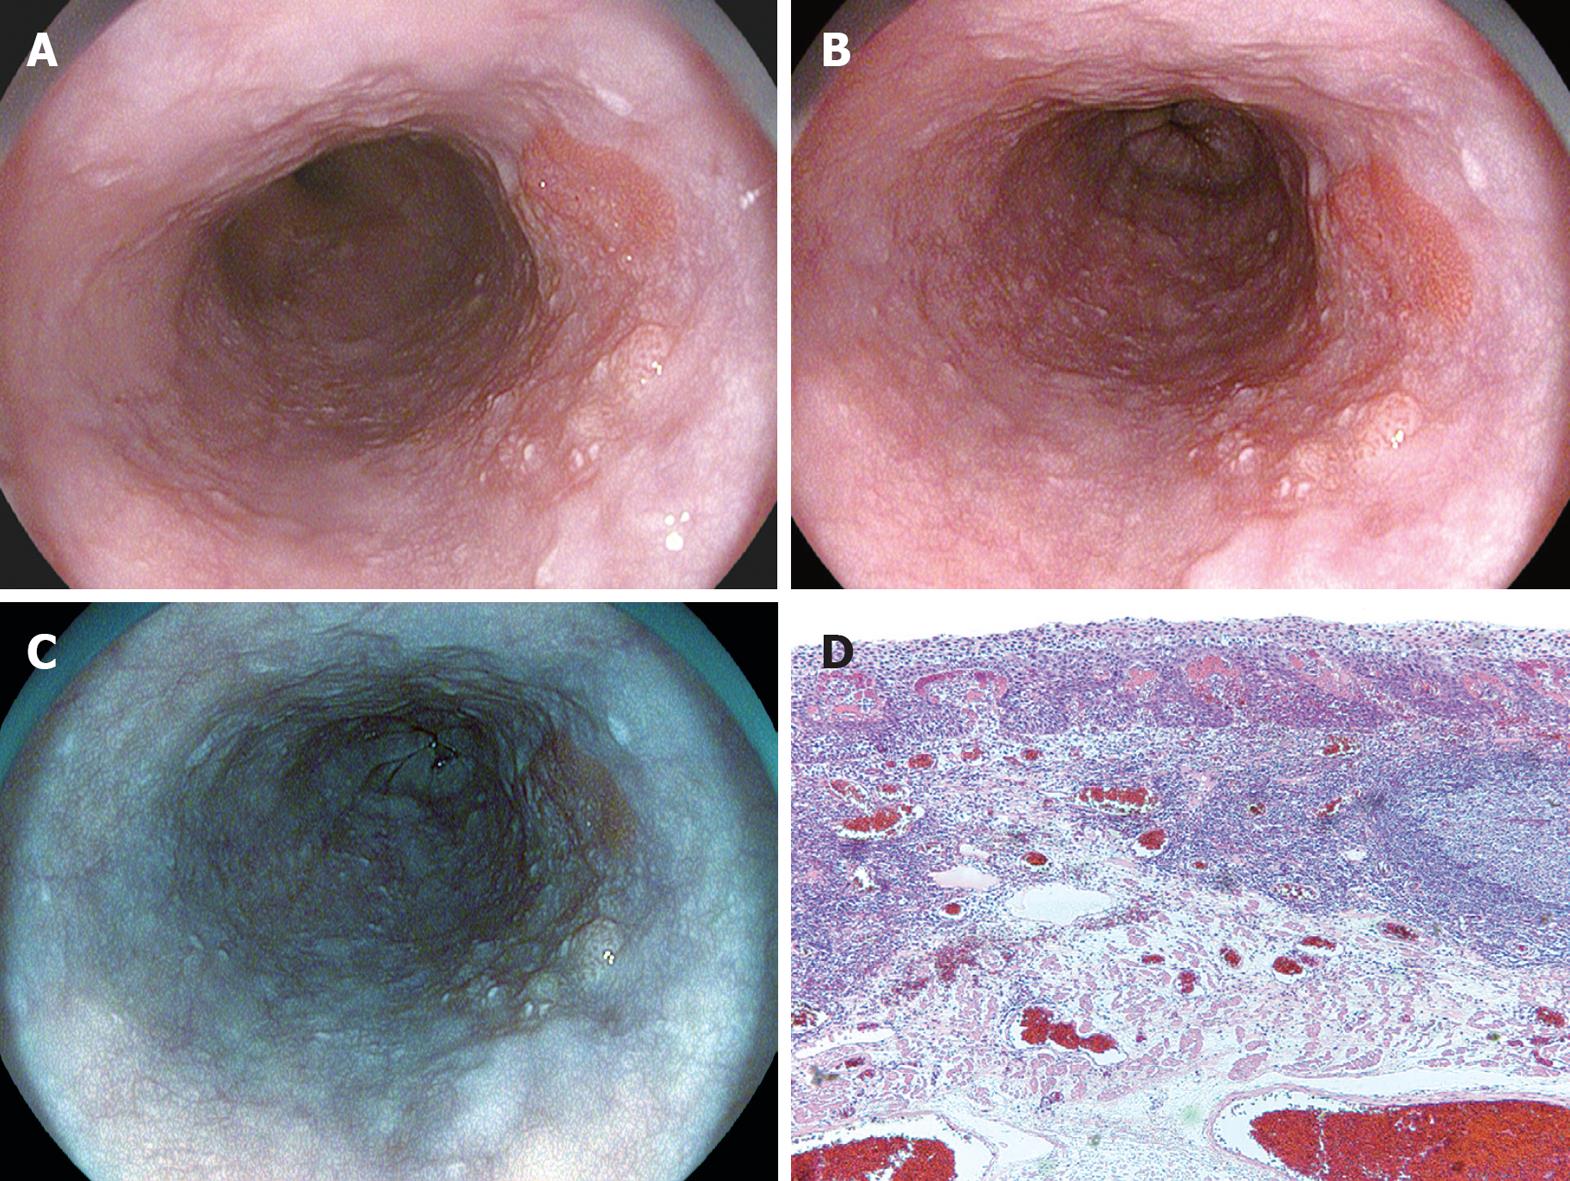
On the ordinary image without i-scanning, a slightly irregular mucosal structure was visible on the right wall of the middle thoracic esophagus (Figure 6A). If SE (low) + CE (low) were applied to this image, the irregular mucosal structure could be discerned as an area structurally different from the surrounding normal area, with almost the entire circumference of the boundary visible (Figure 6B). If TE-e was applied to this area (Figure 6C), the irregular mucosal structure was visible clearly as a structure differing in color tone from the well-demarcated surrounding area. Endoscopic resection was eventually performed on this lesion, which was rated as carcinoma in situ that corresponded to this region (Figure 6D).
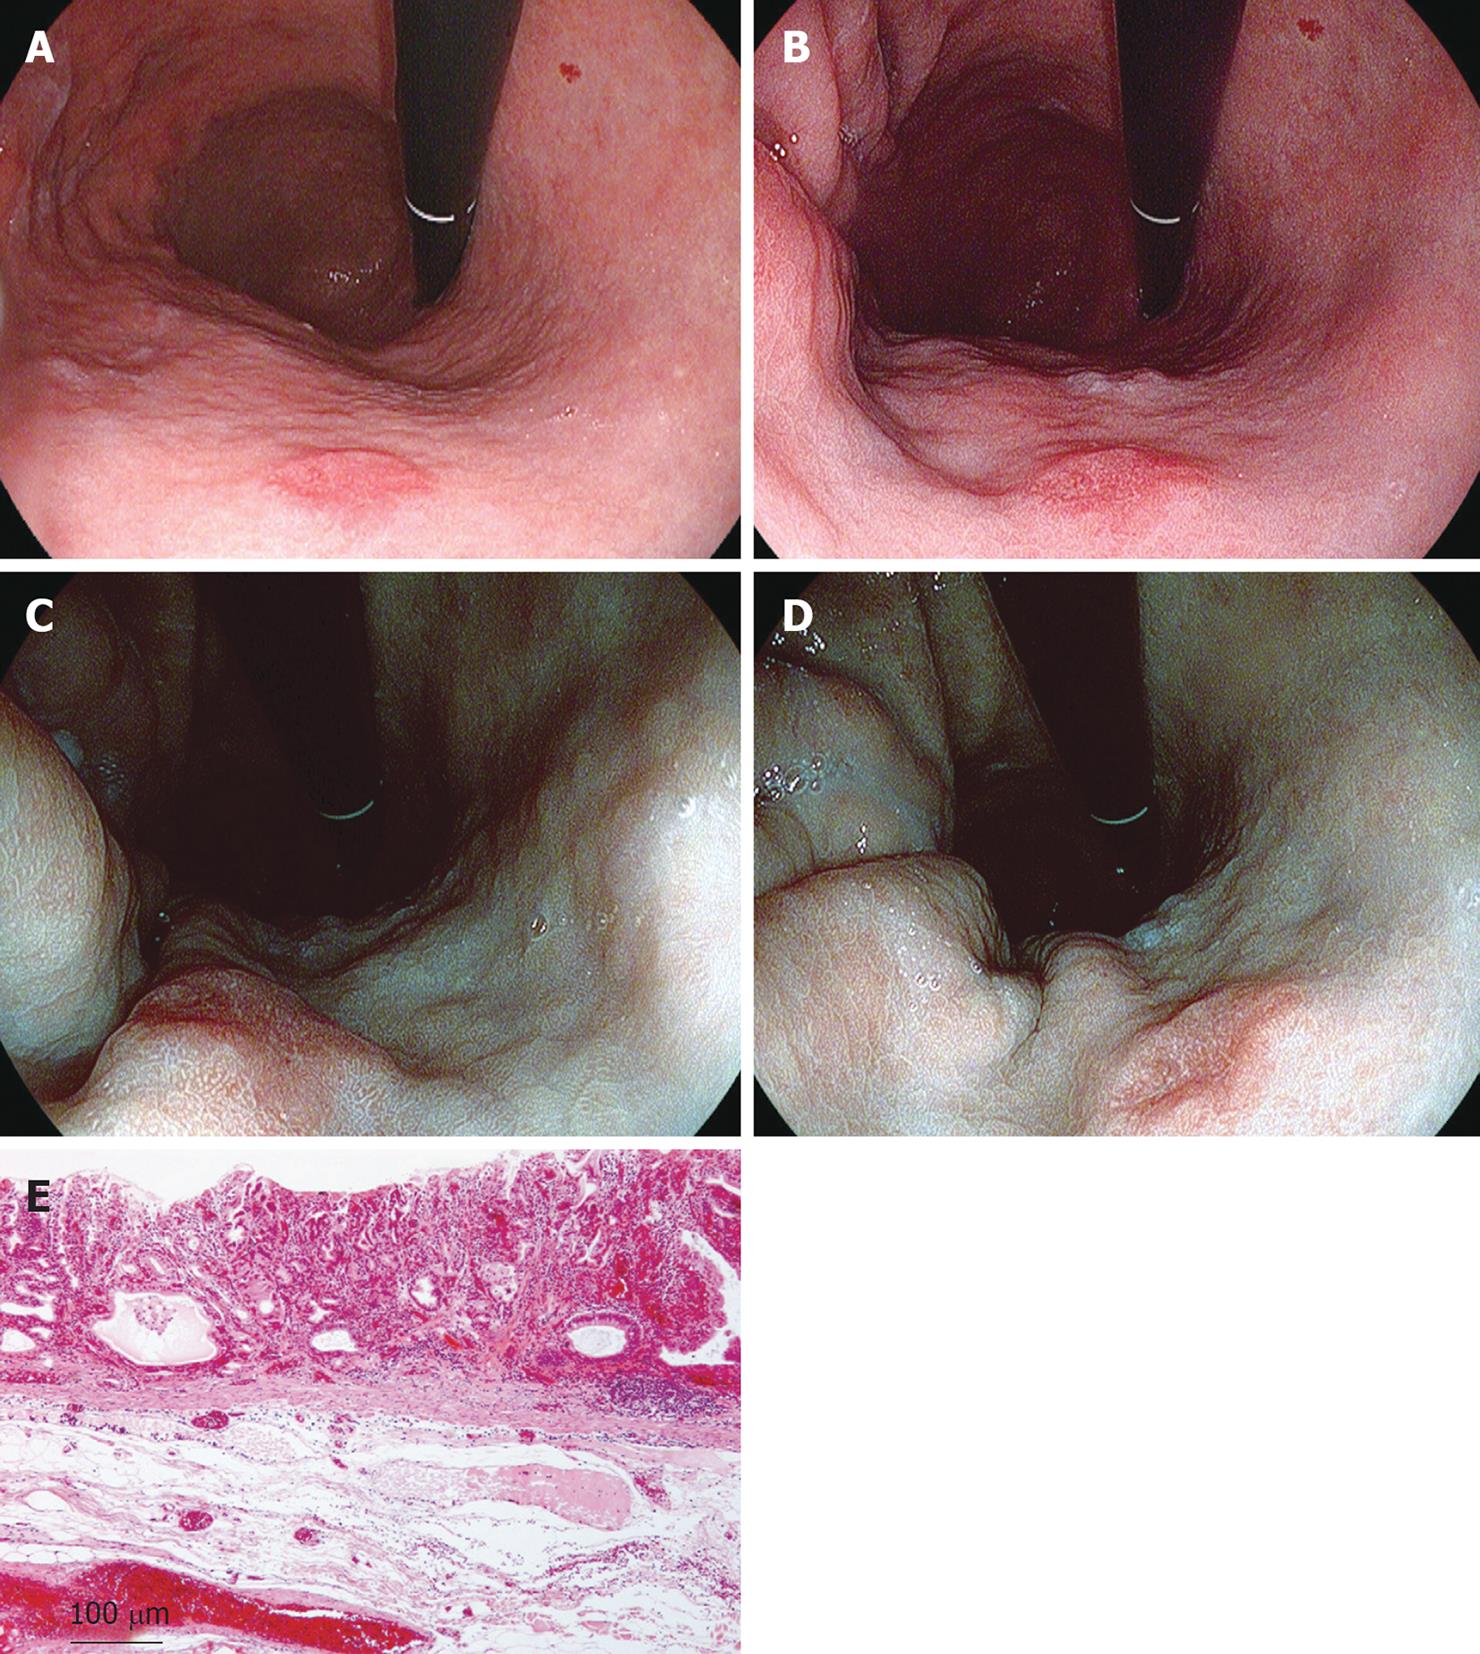
On an ordinary image without i-scanning, a red depressed lesion with marginal elevation was visible on the anterior wall of the lower gastric body, although the demarcation of the lesion could not be recognized clearly (Figure 7A). If the same area was observed with SE (low) + CE (low), the differences of the mucosal structure and color of the lesion could be observed, although the boundary was not clear (Figure 7B). If TE-g was applied to this image (Figure 7C and D), the normal mucosa changed color into brown or green, the reddish area remained reddish, and the minute glandular structure was clearly visible. Therefore, the difference in color tone from the normal area became clearer and it was possible to make a full-circumferential assessment of the boundary of a lesion based on a check of changes in mucosal structure and color tone. The lesion was finally resected endoscopically and was rated histopathologically as a well to moderately differentiated adenocarcinoma localized in the mucosal layer (Figure 7E).
SE and CE can elevate the capability of discerning lesions during screening. TE allows detailed evaluation of the lesion found during screening. All of these three enhancement modes can be switched on/off instantaneously, which reduces the mental stress of the examiners. In addition, because these techniques can reduce the frequency of tests involving dye spraying and biopsy, they are advantageous also for patients. We believe that i-scan can elevate the quality of endoscopic diagnosis and treatment.
Peer reviewers: Dr. William Kemp, MB, BS (hons), FRACP, Department of Gastroenterology, Alfred Hospital, PO Box 315 Prahran, 55 Commercial Road, Melbourne 3181, Australia; Jae J Kim, MD, PhD, Associate Professor, Department of Medicine, Samsung Medical Center, Sungkyunkwan University School of Medicine, 50, Irwon-dong, Gangnam-gu, Seoul 135-710, South Korea
S- Editor Tian L L- Editor Kerr C E- Editor Ma WH
| 1. | Tajiri H, Niwa H. Proposal for a consensus terminology in endoscopy: how should different endoscopic imaging techniques be grouped and defined? Endoscopy. 2008;40:775-778. [Cited in This Article: ] |
| 2. | Yoshida T, Inoue H, Usui S, Satodate H, Fukami N, Kudo SE. Narrow-band imaging system with magnifying endoscopy for superficial esophageal lesions. Gastrointest Endosc. 2004;59:288-295. [Cited in This Article: ] |
| 3. | Kuznetsov K, Lambert R, Rey JF. Narrow-band imaging: potential and limitations. Endoscopy. 2006;38:76-81. [Cited in This Article: ] |
| 4. | Goda K, Tajiri H, Ikegami M, Yoshida Y, Yoshimura N, Kato M, Sumiyama K, Imazu H, Matsuda K, Kaise M. Magnifying endoscopy with narrow band imaging for predicting the invasion depth of superficial esophageal squamous cell carcinoma. Dis Esophagus. 2009;22:453-460. [Cited in This Article: ] |
| 5. | Kuraoka K, Hoshino E, Tsuchida T, Fujisaki J, Takahashi H, Fujita R. Early esophageal cancer can be detected by screening endoscopy assisted with narrow-band imaging (NBI). Hepatogastroenterology. 2009;56:63-66. [Cited in This Article: ] |
| 6. | Nakayoshi T, Tajiri H, Matsuda K, Kaise M, Ikegami M, Sasaki H. Magnifying endoscopy combined with narrow band imaging system for early gastric cancer: correlation of vascular pattern with histopathology (including video). Endoscopy. 2004;36:1080-1084. [Cited in This Article: ] |
| 7. | Yao K, Anagnostopoulos GK, Ragunath K. Magnifying endoscopy for diagnosing and delineating early gastric cancer. Endoscopy. 2009;41:462-467. [Cited in This Article: ] |
| 8. | Kaise M, Kato M, Urashima M, Arai Y, Kaneyama H, Kanzazawa Y, Yonezawa J, Yoshida Y, Yoshimura N, Yamasaki T. Magnifying endoscopy combined with narrow-band imaging for differential diagnosis of superficial depressed gastric lesions. Endoscopy. 2009;41:310-315. [Cited in This Article: ] |
| 9. | Kida M, Kobayashi K, Saigenji K. Routine chromoendoscopy for gastrointestinal diseases: indications revised. Endoscopy. 2003;35:590-596. [Cited in This Article: ] |
| 10. | Ida K, Hashimoto Y, Takeda S, Murakami K, Kawai K. Endoscopic diagnosis of gastric cancer with dye scattering. Am J Gastroenterol. 1975;63:316-320. [Cited in This Article: ] |


