Copyright
©2010 Baishideng.
World J Gastroenterol. Feb 14, 2010; 16(6): 755-763
Published online Feb 14, 2010. doi: 10.3748/wjg.v16.i6.755
Published online Feb 14, 2010. doi: 10.3748/wjg.v16.i6.755
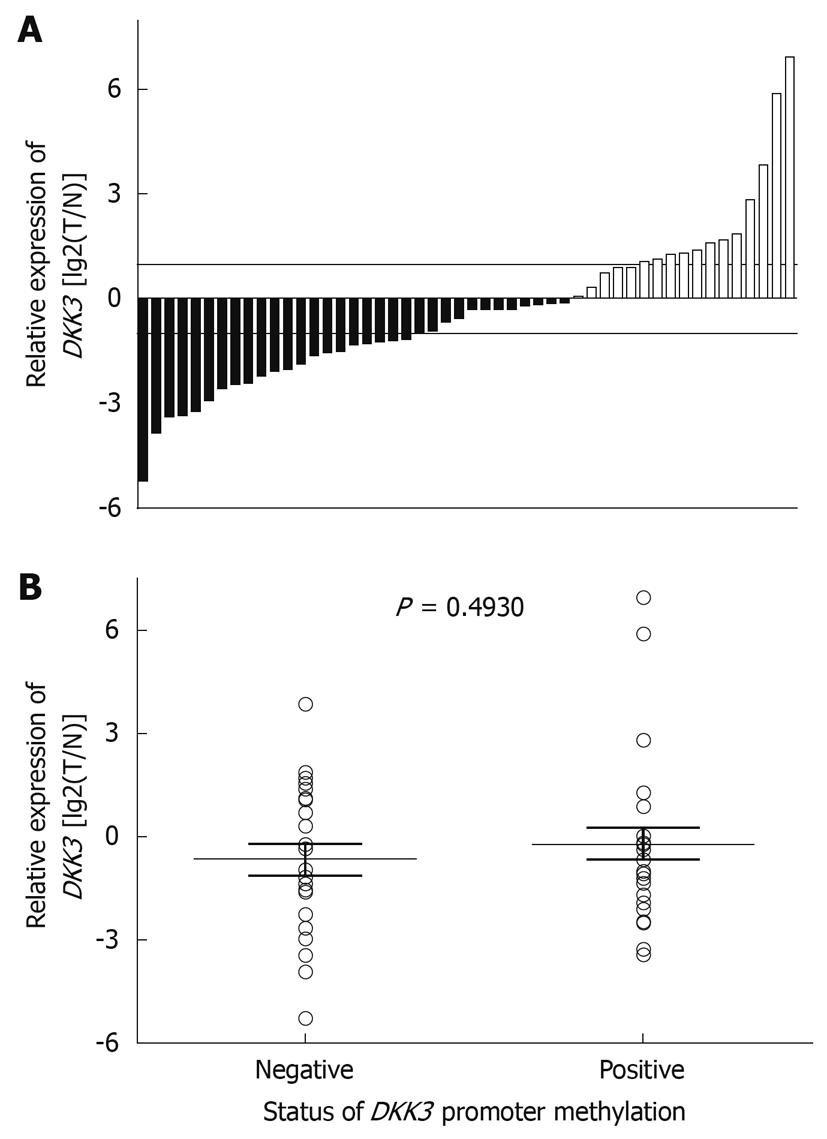
Figure 3 Expression of DKK3 mRNA in HCC (A) and NCL (B) tissue samples.
Horizontal lines represent the median FC value, and range indicates 25%-75% quartile.
-
Citation: Yang B, Du Z, Gao YT, Lou C, Zhang SG, Bai T, Wang YJ, Song WQ. Methylation of
Dickkopf-3 as a prognostic factor in cirrhosis-related hepatocellular carcinoma. World J Gastroenterol 2010; 16(6): 755-763 - URL: https://www.wjgnet.com/1007-9327/full/v16/i6/755.htm
- DOI: https://dx.doi.org/10.3748/wjg.v16.i6.755


