Copyright
©2010 Baishideng.
World J Gastroenterol. Feb 14, 2010; 16(6): 755-763
Published online Feb 14, 2010. doi: 10.3748/wjg.v16.i6.755
Published online Feb 14, 2010. doi: 10.3748/wjg.v16.i6.755
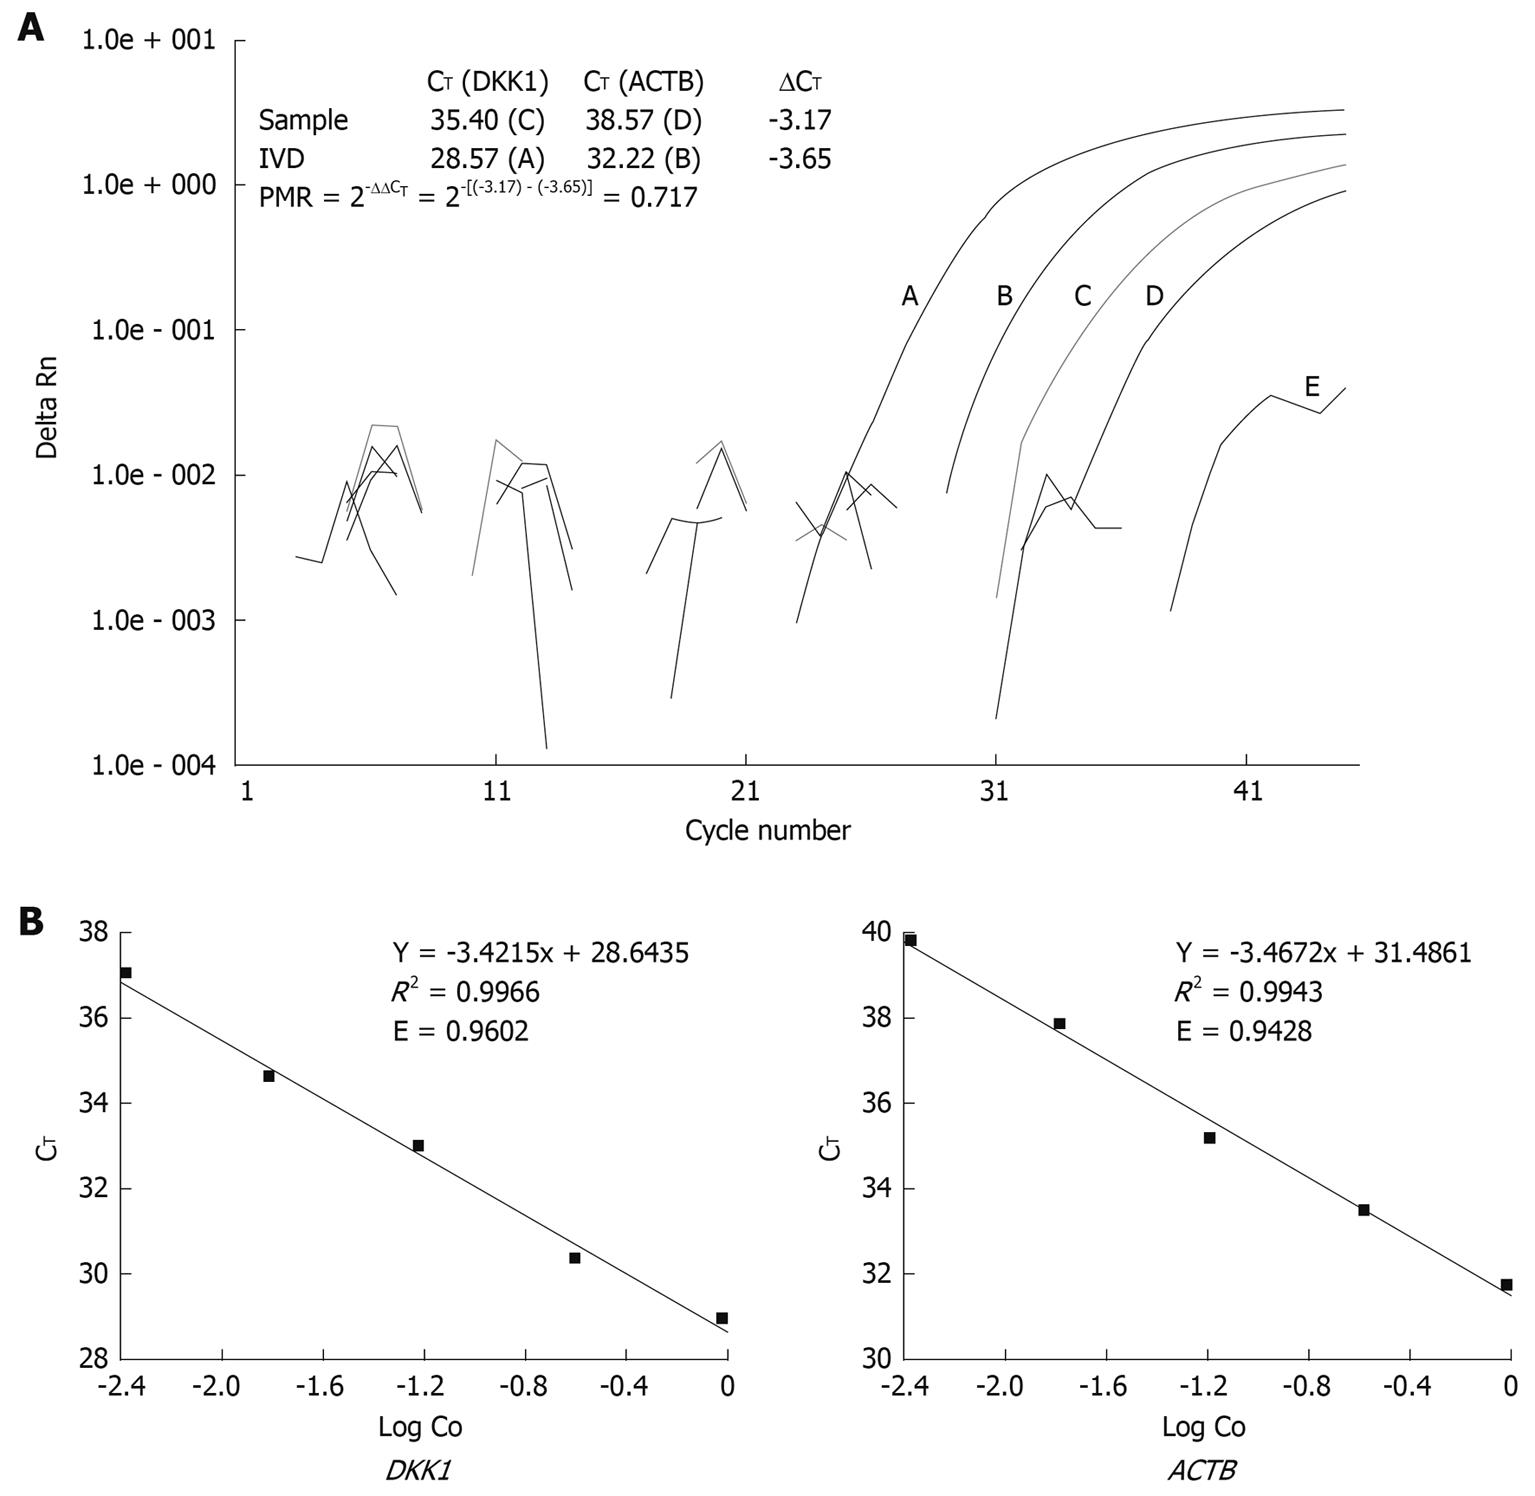
Figure 1 Quantitative methylation analysis using comparative CT method.
A: Representative quantitative methylation-specific polymerase chain reaction (Q-MSP) amplification plots for DKK1 and illustration for percent of methylated reference (PMR) calculation with comparative CT method; B: Validation experiment for comparative CT method, E = 10(-1/Slope) - 1, where E: PCR efficiency; Slope: Slope of calibration curve. DKK: Dickkopf.
-
Citation: Yang B, Du Z, Gao YT, Lou C, Zhang SG, Bai T, Wang YJ, Song WQ. Methylation of
Dickkopf-3 as a prognostic factor in cirrhosis-related hepatocellular carcinoma. World J Gastroenterol 2010; 16(6): 755-763 - URL: https://www.wjgnet.com/1007-9327/full/v16/i6/755.htm
- DOI: https://dx.doi.org/10.3748/wjg.v16.i6.755


