Copyright
©2010 Baishideng Publishing Group Co.
World J Gastroenterol. Dec 21, 2010; 16(47): 5965-5974
Published online Dec 21, 2010. doi: 10.3748/wjg.v16.i47.5965
Published online Dec 21, 2010. doi: 10.3748/wjg.v16.i47.5965
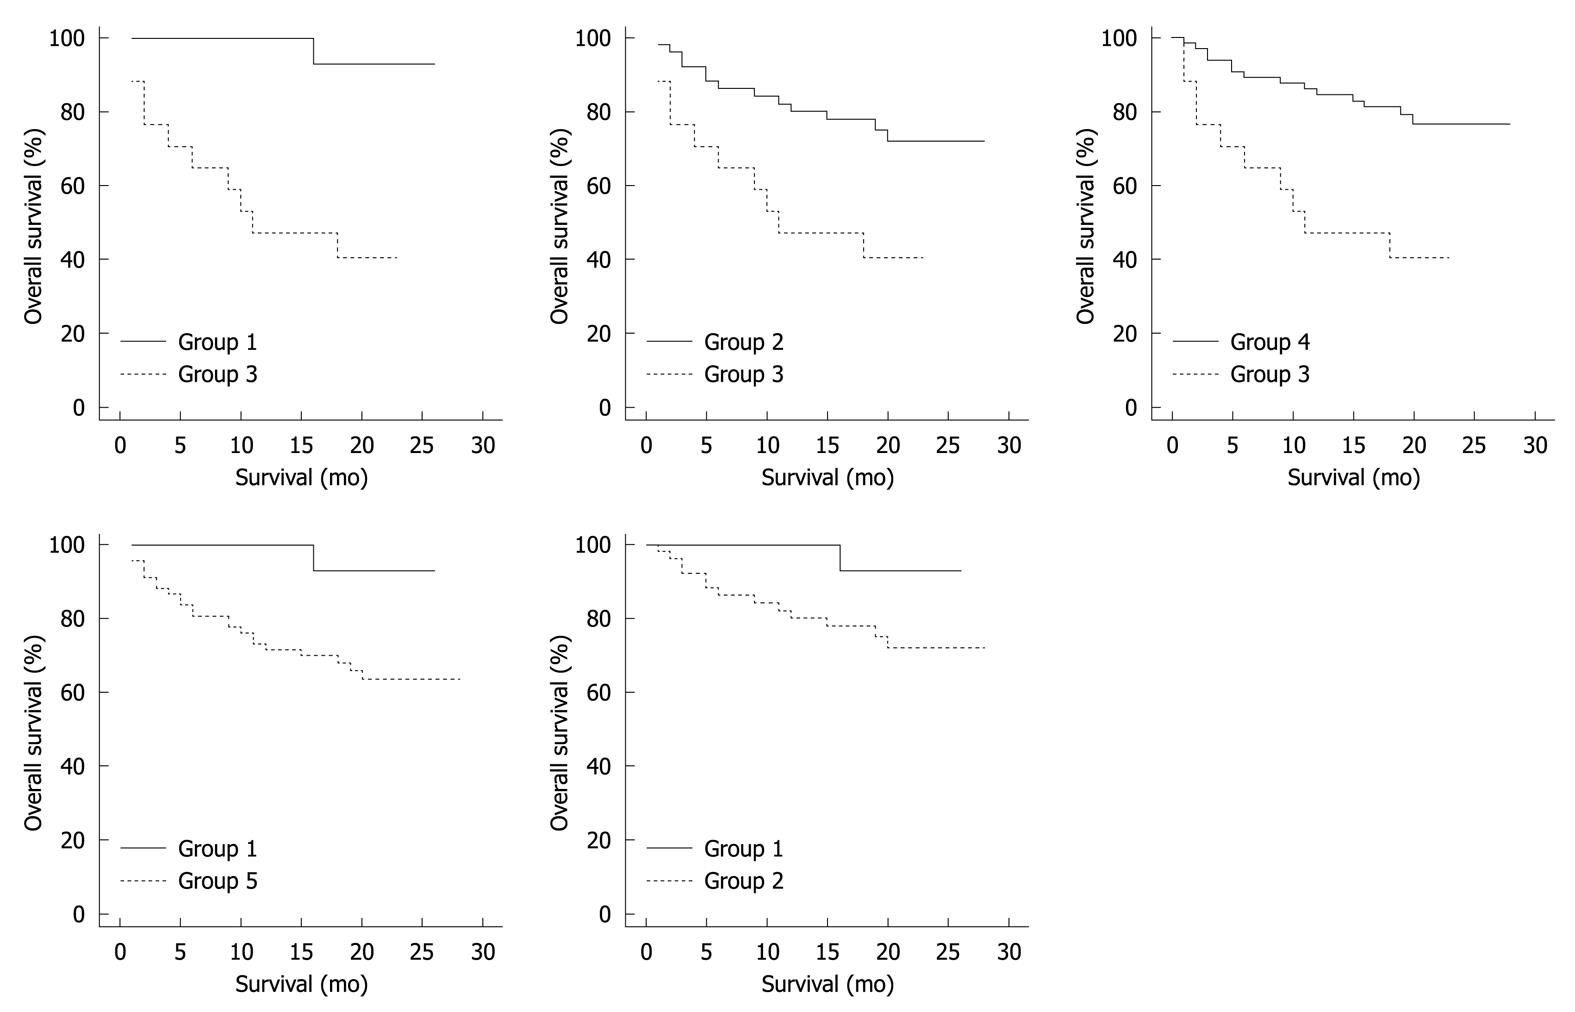
Figure 2 Kaplan-Meier analysis comparing the overall survival of patient groups as developed according to transcript detection patterns for carcinoembryonic antigen, cytokeratin 20 and epidermal growth factor receptor.
Group 1: Carcinoembryonic antigen (CEA) positive; Group 2: Positive for 2 markers (CEA and cytokeratin 20); Group 3: Positive for all markers; Group 4: Combination of groups 1 and 2; Group 5: Combination of groups 2 and 3. Log Rank test P values were as follows: Groups 1 vs 3: P = 0.002; Groups 2 vs 3: P = 0.007; Groups 4 vs 3: P = 0.001; Groups 1 vs 5: P = 0.041; Groups 1 vs 2: P = 0.116.
- Citation: Tsouma A, Aggeli C, Lembessis P, Zografos GN, Korkolis DP, Pectasides D, Skondra M, Pissimissis N, Tzonou A, Koutsilieris M. Multiplex RT-PCR-based detections of CEA, CK20 and EGFR in colorectal cancer patients. World J Gastroenterol 2010; 16(47): 5965-5974
- URL: https://www.wjgnet.com/1007-9327/full/v16/i47/5965.htm
- DOI: https://dx.doi.org/10.3748/wjg.v16.i47.5965


