Copyright
©2010 Baishideng Publishing Group Co.
World J Gastroenterol. Dec 21, 2010; 16(47): 5958-5964
Published online Dec 21, 2010. doi: 10.3748/wjg.v16.i47.5958
Published online Dec 21, 2010. doi: 10.3748/wjg.v16.i47.5958
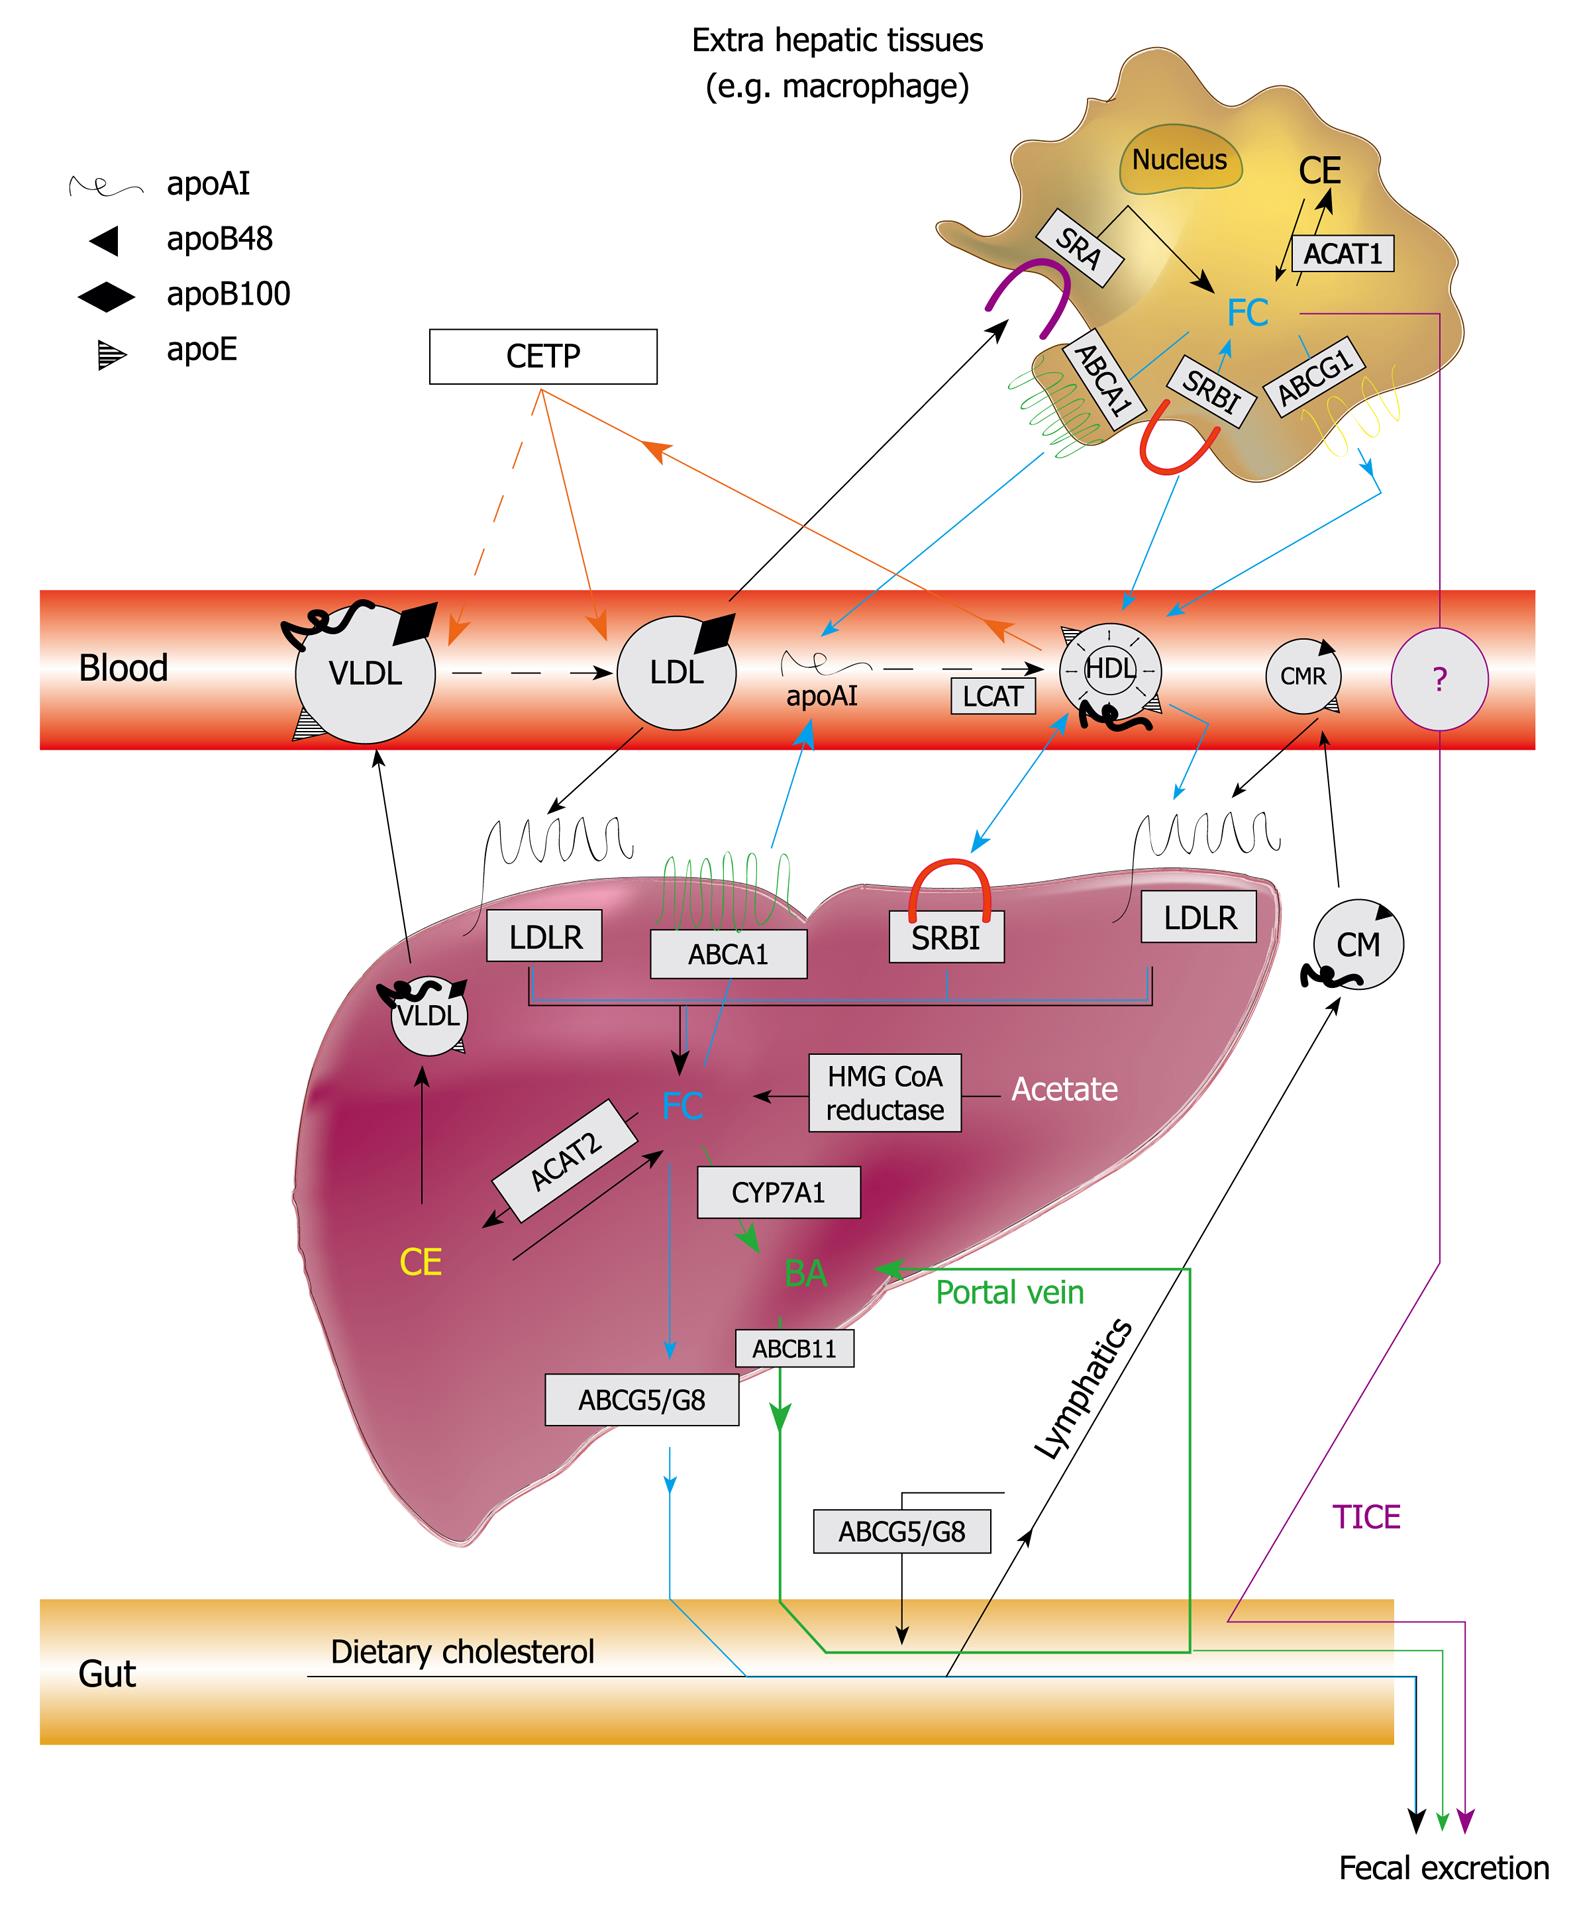
Figure 1 Schematic overview of cholesterol, bile acid, and lipoprotein metabolism.
CE: Cholesteryl esters; FC: Free cholesterol; BA: Bile acids; CM: Chylomicrons; CMR: Chylomicron remnants; VLDL: Very low density lipoprotein; LDL: Low density lipoprotein; HDL: High density lipoprotein; apoAI: Apolipoprotein AI; apoB48: Apolipoprotein B48; apoB100: Apolipoprotein B100; apoE: Apolipoprotein E; CETP: Cholesterol ester transfer protein; LCAT: Lecithin cholesterol acyltransferase; LDLR: LDL receptor; ABCA1: ATP-binding cassette transporter A1; ABCG1: ATP-binding cassette transporter G1; ABCG5: ATP-binding cassette transporter G5; ABCG8: ATP-binding cassette transporter G8; ABCB11: ATP-binding cassette transporter B11; SRA: Scavenger receptor type A; SRBI: Scavenger receptor type BI; ACAT1: Acyl-coenzyme A cholesterol acyltransferase 1; ACAT2: Acyl-coenzyme A cholesterol acyltransferase 2; HMGCoA reductase: 3-hydroxy-3-methylglutaryl coenzyme A reductase; CYP7A1: Cholesterol 7α-hydroxylase. Blue lines and arrows represent reverse cholesterol transport. Green lines and arrows represent entero-hepatic bile acid circulation. Purple line and arrows represent transintestinal cholesterol excretion (TICE). Red lines and arrows represent the CETP mediated transfer of CE from HDL to LDL and to VLDL.
- Citation: Pedrelli M, Pramfalk C, Parini P. Thyroid hormones and thyroid hormone receptors: Effects of thyromimetics on reverse cholesterol transport. World J Gastroenterol 2010; 16(47): 5958-5964
- URL: https://www.wjgnet.com/1007-9327/full/v16/i47/5958.htm
- DOI: https://dx.doi.org/10.3748/wjg.v16.i47.5958


