Copyright
©2010 Baishideng Publishing Group Co.
World J Gastroenterol. Nov 7, 2010; 16(41): 5162-5172
Published online Nov 7, 2010. doi: 10.3748/wjg.v16.i41.5162
Published online Nov 7, 2010. doi: 10.3748/wjg.v16.i41.5162
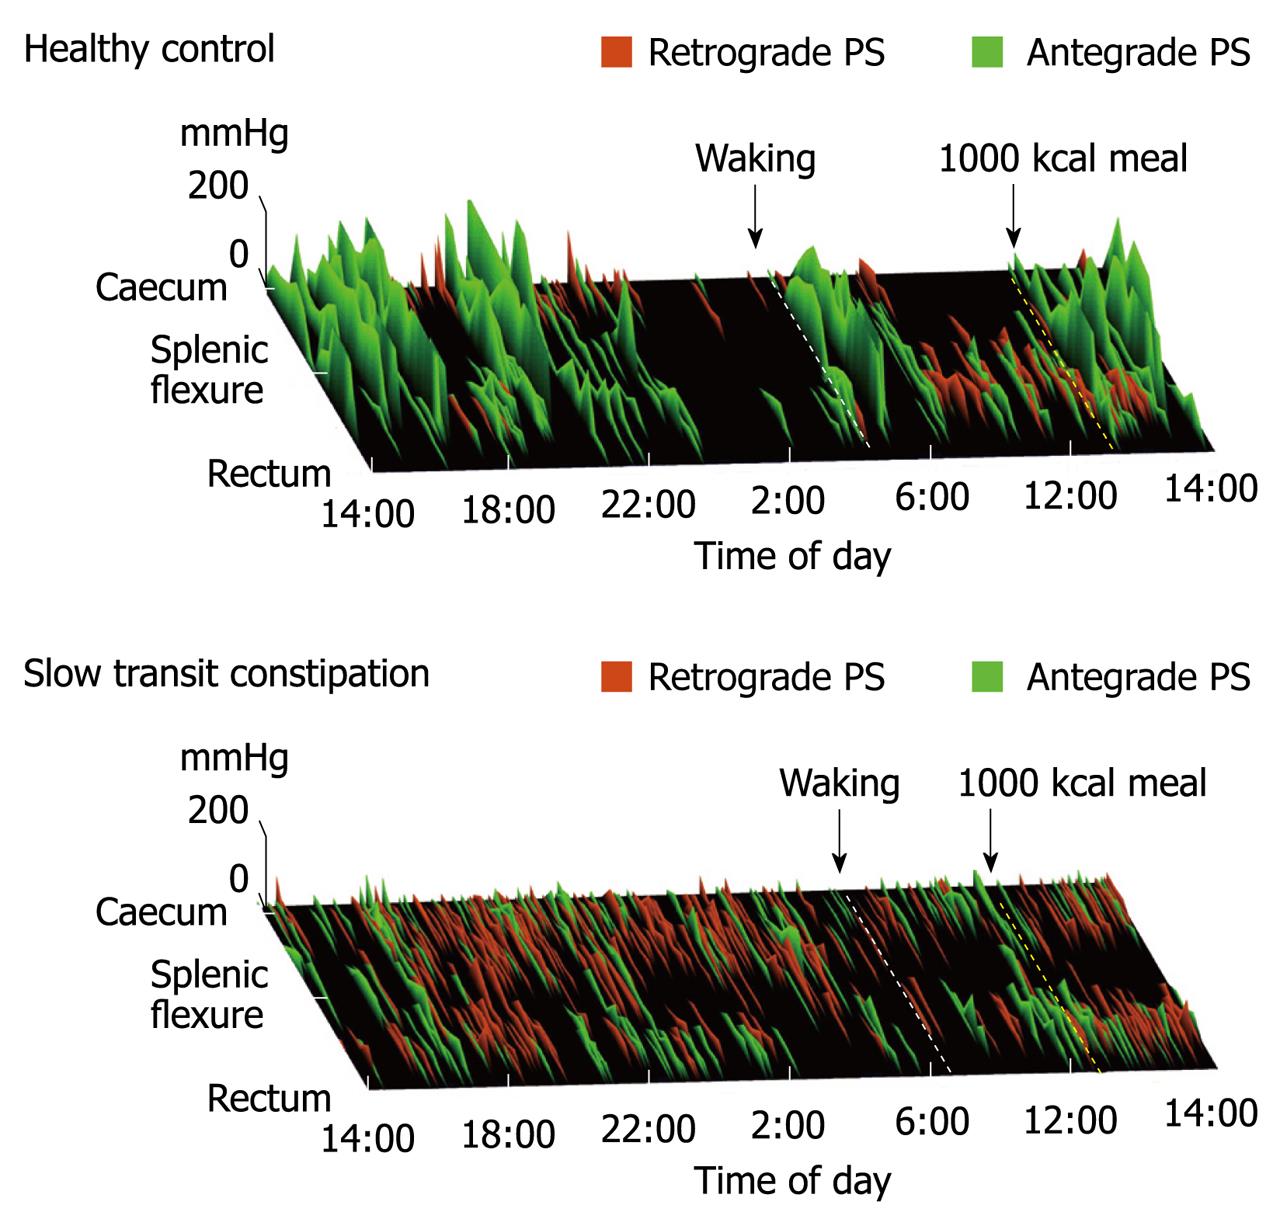
Figure 4 Twenty-four hour spatiotemporal maps[80] of colonic propagating sequences in a female healthy control and a female patient with slow transit constipation.
Within each map the ridges represent antegrade (green) and retrograde (red) propagating sequences (PS). The antegrade PSs originate at the orad end of the green ridge and retrograde PSs originate at the anal end of the red ridges. The start of each antegrade and retrograde ridge indicates the site of origin and the time of day the PS occurred. The length of the ridge indicates the extent of propagation. The height of the ridge indicates the amplitude of the component pressure waves. The yellow-hatched line indicates when the 1000 kcal lunch was given, the white-hatched line indicates the time of morning waking. In health the frequency of propagating sequences are reduced during sleep and increase upon morning waking and in response to a high calorie meal. The map in the STC patients is characterized by an increased frequency of short extent PSs and a lack of high amplitude propagating sequences. There is an absent meal response (no increase in PSs) and an absent nocturnal suppression of PSs.
- Citation: Dinning PG, Benninga MA, Southwell BR, Scott SM. Paediatric and adult colonic manometry: A tool to help unravel the pathophysiology of constipation. World J Gastroenterol 2010; 16(41): 5162-5172
- URL: https://www.wjgnet.com/1007-9327/full/v16/i41/5162.htm
- DOI: https://dx.doi.org/10.3748/wjg.v16.i41.5162


