Copyright
copy;2010 Baishideng Publishing Group Co.
World J Gastroenterol. Sep 28, 2010; 16(36): 4599-4604
Published online Sep 28, 2010. doi: 10.3748/wjg.v16.i36.4599
Published online Sep 28, 2010. doi: 10.3748/wjg.v16.i36.4599
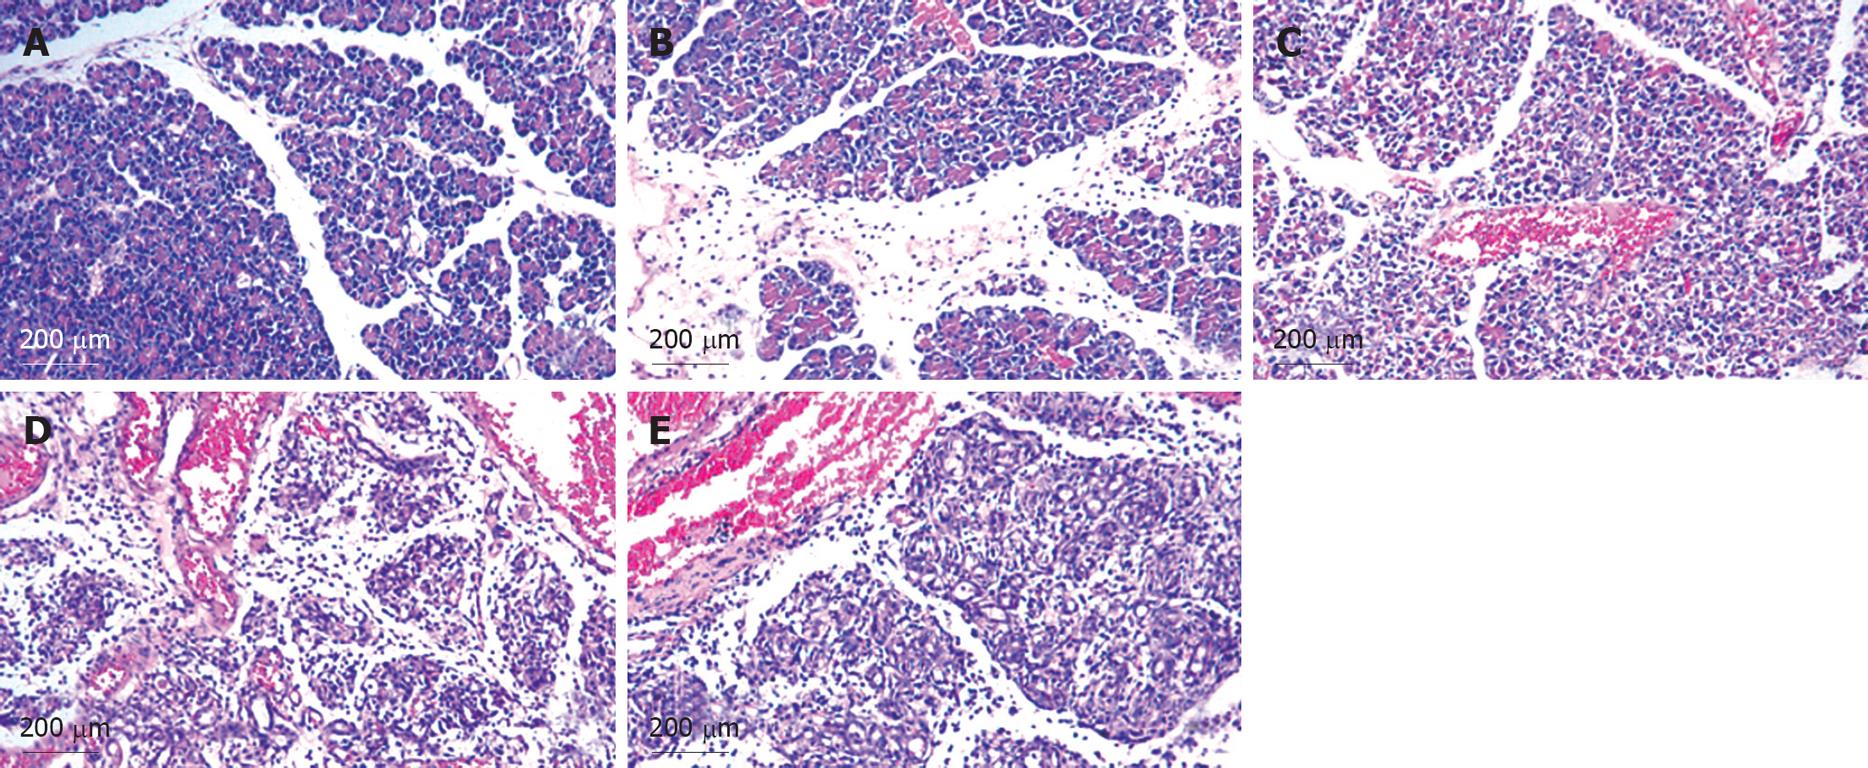
Figure 3 Light micrographs of the pancreas at 0 h (A), 12 h (B), 24 h (C), 48 h (D) and 72 h (E) after arginine injection.
A: Neither interstitial edema nor acinar cell necrosis is seen; B: Interstitial edema and slight cellular infiltration in the interstitium can be seen; C: The acinar structures are partially destroyed. Interstitial edema and inflammatory infiltrate are greater in degree than at 12 h; D: The acinar architecture is markedly disrupted; E: Most pancreatic acinar cells show signs of degeneration or necrosis. Adipose tissue can be seen in the interstitial spaces.
- Citation: Kong XY, Du YQ, Li L, Liu JQ, Wang GK, Zhu JQ, Man XH, Gong YF, Xiao LN, Zheng YZ, Deng SX, Gu JJ, Li ZS. Plasma miR-216a as a potential marker of pancreatic injury in a rat model of acute pancreatitis. World J Gastroenterol 2010; 16(36): 4599-4604
- URL: https://www.wjgnet.com/1007-9327/full/v16/i36/4599.htm
- DOI: https://dx.doi.org/10.3748/wjg.v16.i36.4599


