Copyright
©2010 Baishideng.
World J Gastroenterol. Aug 21, 2010; 16(31): 3944-3949
Published online Aug 21, 2010. doi: 10.3748/wjg.v16.i31.3944
Published online Aug 21, 2010. doi: 10.3748/wjg.v16.i31.3944
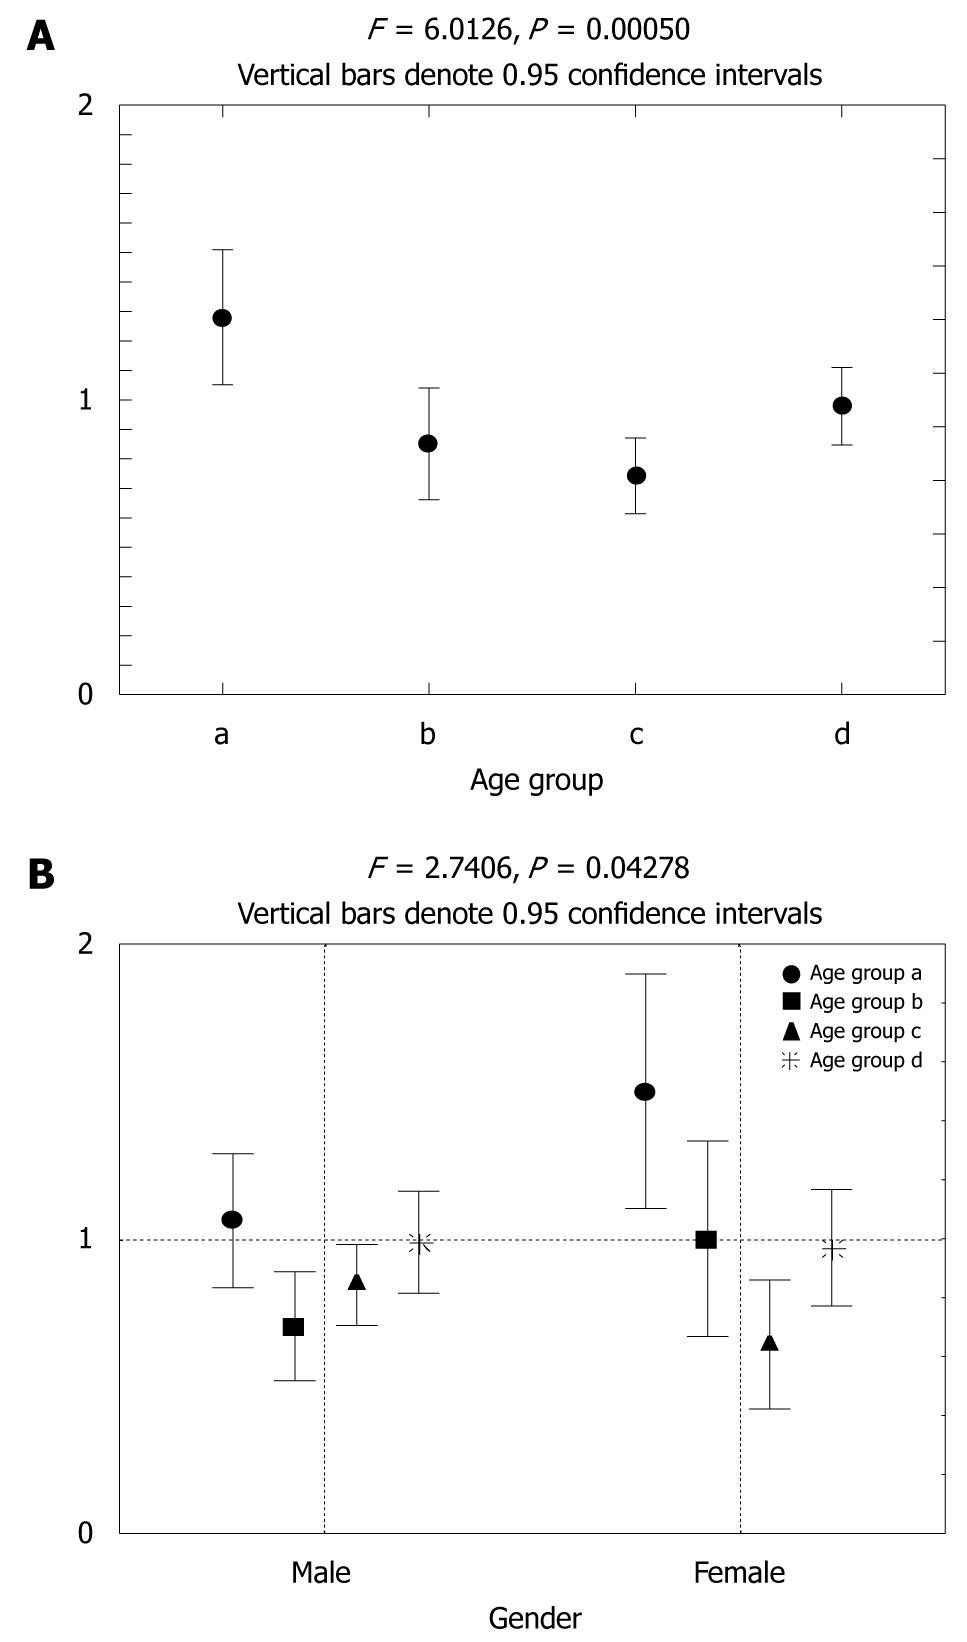
Figure 1 Correlations of age subgroups in different subjects.
A: Correlation of age subgroups (a, b, c and d) in subjects with steatohepatitis (0) and steatosis (1), and normal subjects (2). Mean values for each group are presented. The four age subgroups were defined as follows: < 45 years (group a), 45-60 years (group b), 60-75 years (group c), and > 75 years (group d); B: Correlation of sex and age in subjects with steatohepatitis (2) and steatosis (1), and in normal subjects (0). Data are shown for male and female subjects separately, according to age group.
- Citation: Zois CD, Baltayiannis GH, Bekiari A, Goussia A, Karayiannis P, Doukas M, Demopoulos D, Mitsellou A, Vougiouklakis T, Mitsi V, Tsianos EV. Steatosis and steatohepatitis in postmortem material from Northwestern Greece. World J Gastroenterol 2010; 16(31): 3944-3949
- URL: https://www.wjgnet.com/1007-9327/full/v16/i31/3944.htm
- DOI: https://dx.doi.org/10.3748/wjg.v16.i31.3944


