Copyright
©2010 Baishideng.
World J Gastroenterol. Jul 21, 2010; 16(27): 3377-3384
Published online Jul 21, 2010. doi: 10.3748/wjg.v16.i27.3377
Published online Jul 21, 2010. doi: 10.3748/wjg.v16.i27.3377
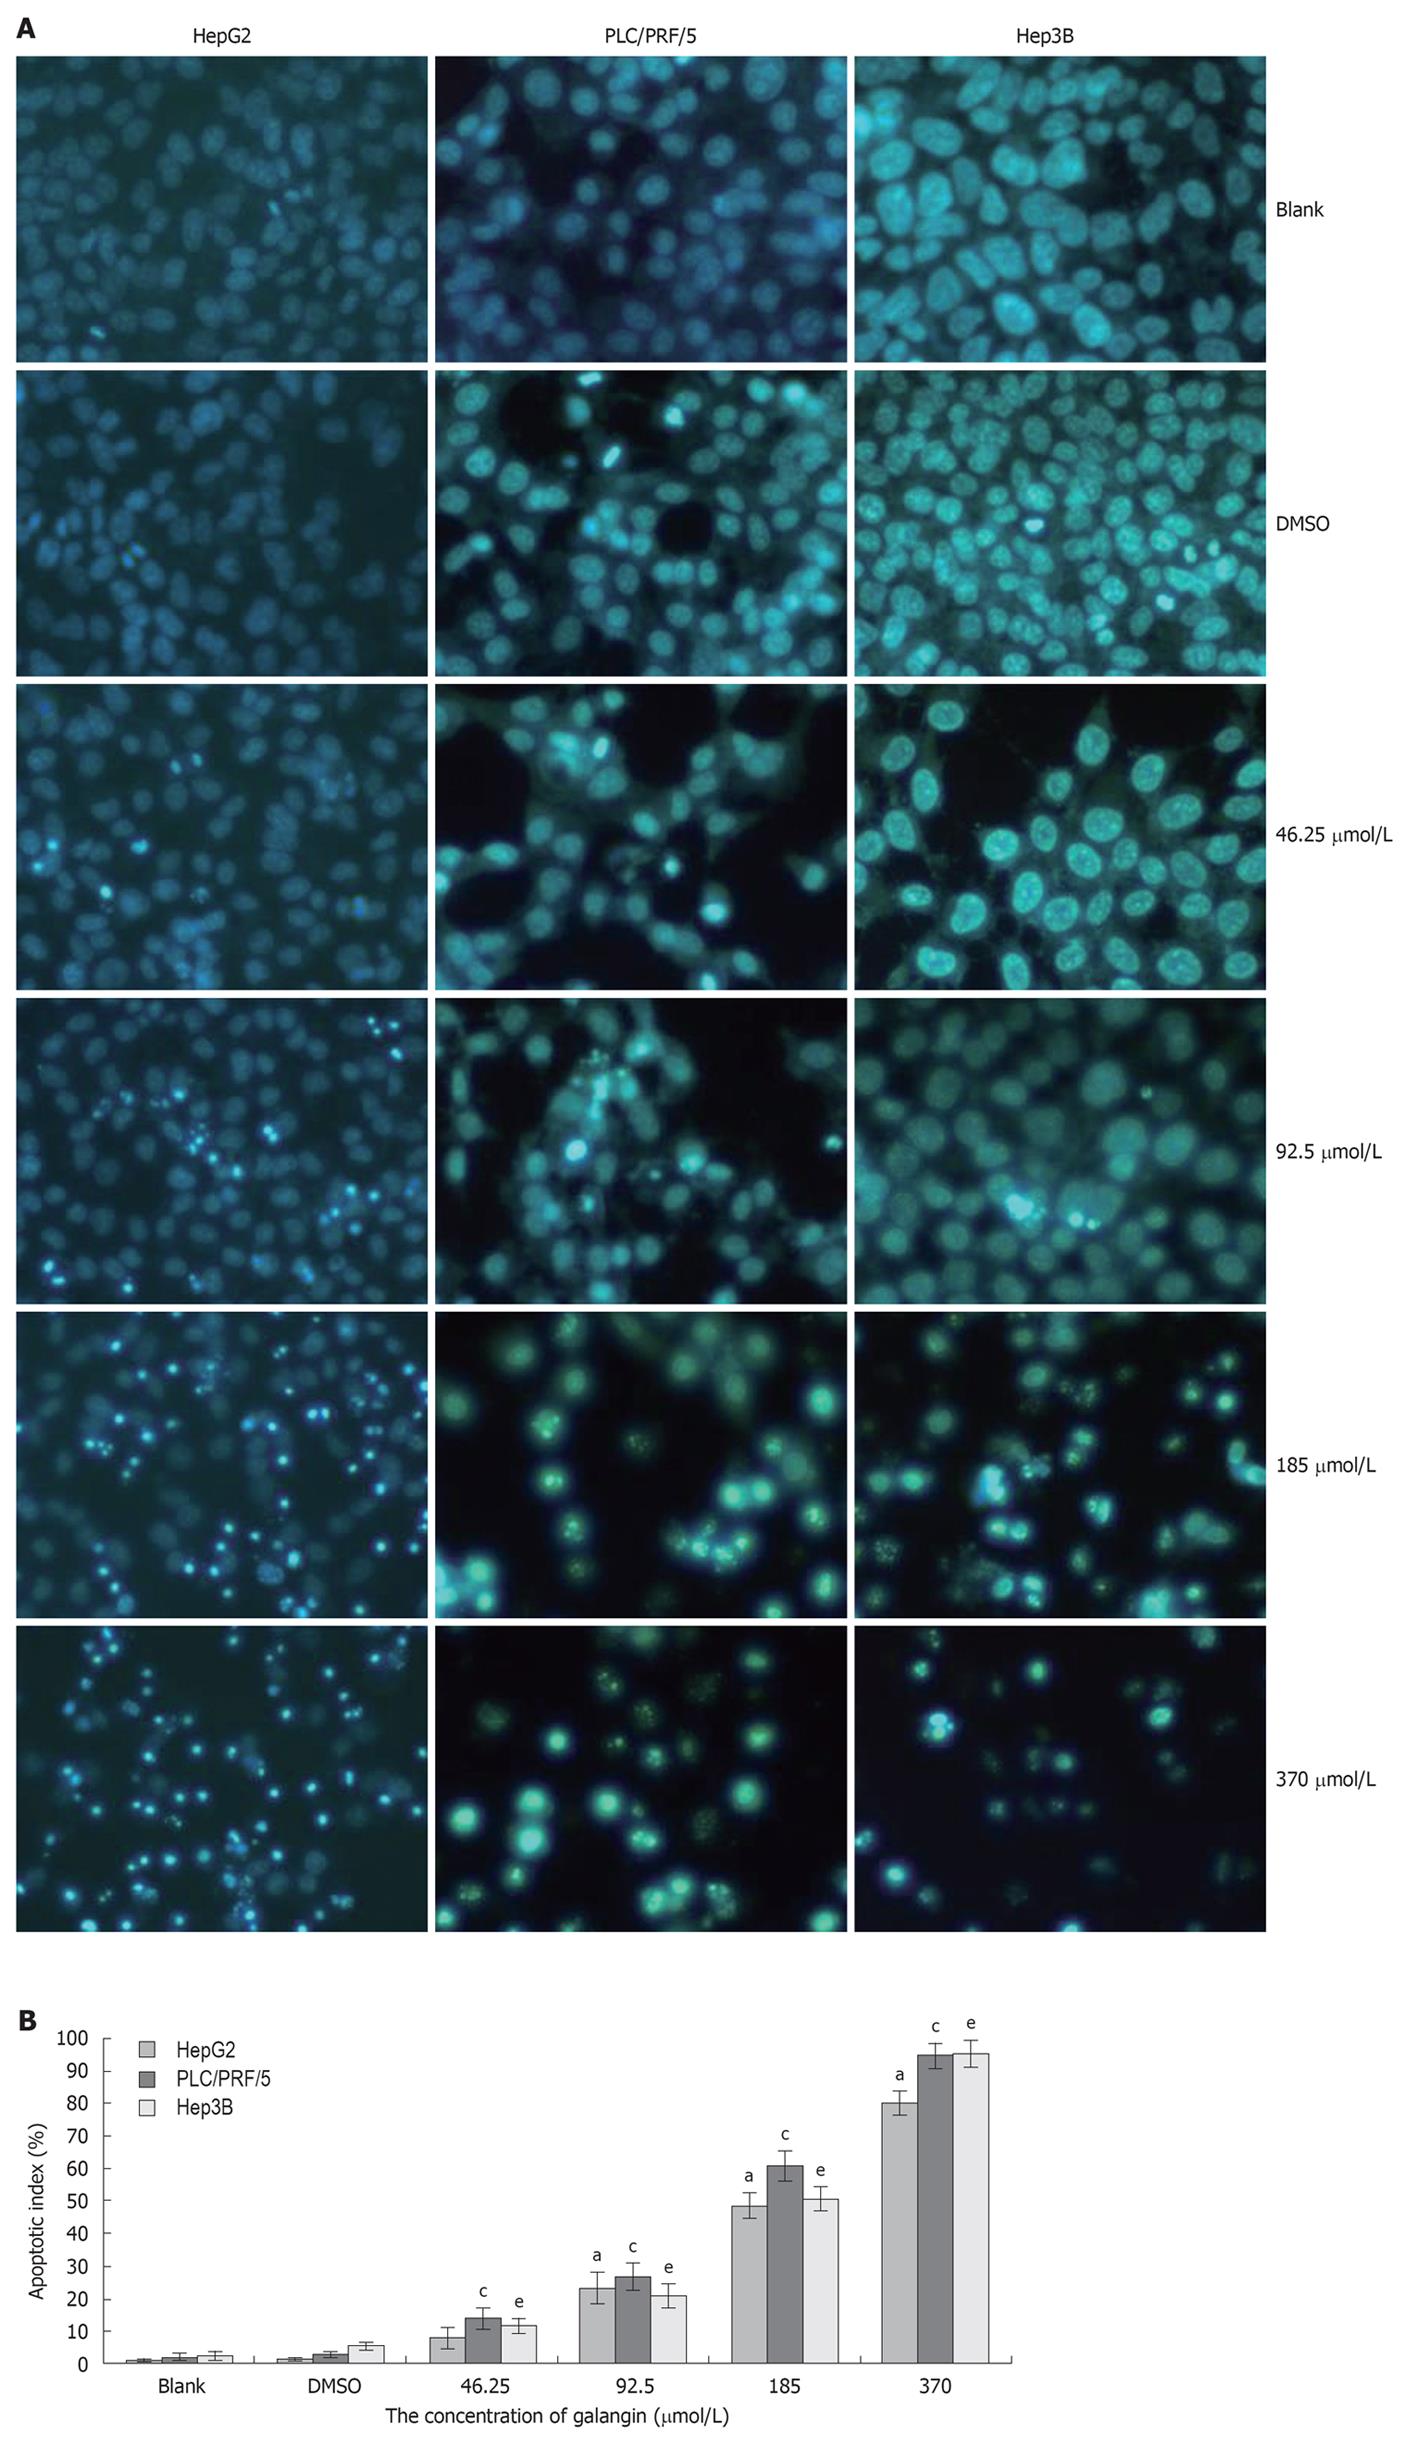
Figure 2 Hepatocellular carcinoma cells apoptosis induced by galangin.
A: Morphology of apoptotic cells, pictures were taken under a 20 × objective; B: Cells were treated with different concentrations of galangin for 24 h and stained with Hoechst 33258/PI to measure apoptosis. mean ± SD. n = 4. aP < 0.05 vs HepG2 cell/dimethyl sulfoxide (DMSO)-treatment group; cP < 0.05 vs PLC/PRF/5 cell/DMSO-treatment group; eP < 0.05 vs Hep3B/DMSO cell/DMSO-treatment group.
-
Citation: Zhang HT, Luo H, Wu J, Lan LB, Fan DH, Zhu KD, Chen XY, Wen M, Liu HM. Galangin induces apoptosis of hepatocellular carcinoma cells
via the mitochondrial pathway. World J Gastroenterol 2010; 16(27): 3377-3384 - URL: https://www.wjgnet.com/1007-9327/full/v16/i27/3377.htm
- DOI: https://dx.doi.org/10.3748/wjg.v16.i27.3377


