Copyright
©2010 Baishideng.
World J Gastroenterol. Jun 14, 2010; 16(22): 2754-2763
Published online Jun 14, 2010. doi: 10.3748/wjg.v16.i22.2754
Published online Jun 14, 2010. doi: 10.3748/wjg.v16.i22.2754
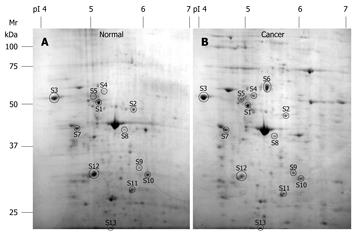
Figure 1 Protein expression profiles of normal mucosa (A) and CRC tissues (B).
S1: F1-ATPase β subunit; S2: Ubiquinol-cytochrome C reductase; S3: Calreticulin; S4: Tubulin α-1 chain; S5: Tubulin β-2 chain; S6: Chaperonin GroEL; S7: Heat shock 70 kDa protein 5; S8: Stomatin-like protein 2; S9: Annexin A3; S10: Annexin A4; S11: Prohibitin; S12: Annexin V; S13: ATP synthase D chain.
- Citation: Yeoh LC, Loh CK, Gooi BH, Singh M, Gam LH. Hydrophobic protein in colorectal cancer in relation to tumor stages and grades. World J Gastroenterol 2010; 16(22): 2754-2763
- URL: https://www.wjgnet.com/1007-9327/full/v16/i22/2754.htm
- DOI: https://dx.doi.org/10.3748/wjg.v16.i22.2754


