Copyright
©2010 Baishideng.
World J Gastroenterol. May 21, 2010; 16(19): 2428-2434
Published online May 21, 2010. doi: 10.3748/wjg.v16.i19.2428
Published online May 21, 2010. doi: 10.3748/wjg.v16.i19.2428
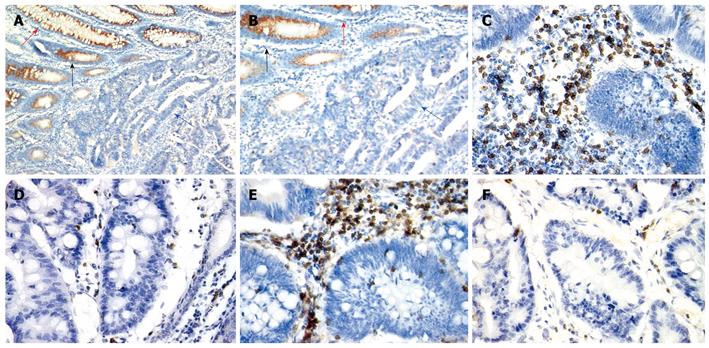
Figure 1 Expression level of CRT in cancer nest (A) and in its adjacent normal epithelium (B) [× 100 in A, × 200 in B, normal epithelium (red arrow), atypical hyperplasia (black arrow) and tumor tissue (blue arrow), respectively], high infiltration of CD3+ cells (C) and CD45RO+ cells (E) in colon cancer stroma (× 400), low infiltration of CD3+ cells (D) and CD45RO+ cells (F) in colon cancer stroma (× 400).
- Citation: Peng RQ, Chen YB, Ding Y, Zhang R, Zhang X, Yu XJ, Zhou ZW, Zeng YX, Zhang XS. Expression of calreticulin is associated with infiltration of T-cells in stage IIIB colon cancer. World J Gastroenterol 2010; 16(19): 2428-2434
- URL: https://www.wjgnet.com/1007-9327/full/v16/i19/2428.htm
- DOI: https://dx.doi.org/10.3748/wjg.v16.i19.2428


