Copyright
©2010 Baishideng.
World J Gastroenterol. Apr 7, 2010; 16(13): 1649-1654
Published online Apr 7, 2010. doi: 10.3748/wjg.v16.i13.1649
Published online Apr 7, 2010. doi: 10.3748/wjg.v16.i13.1649
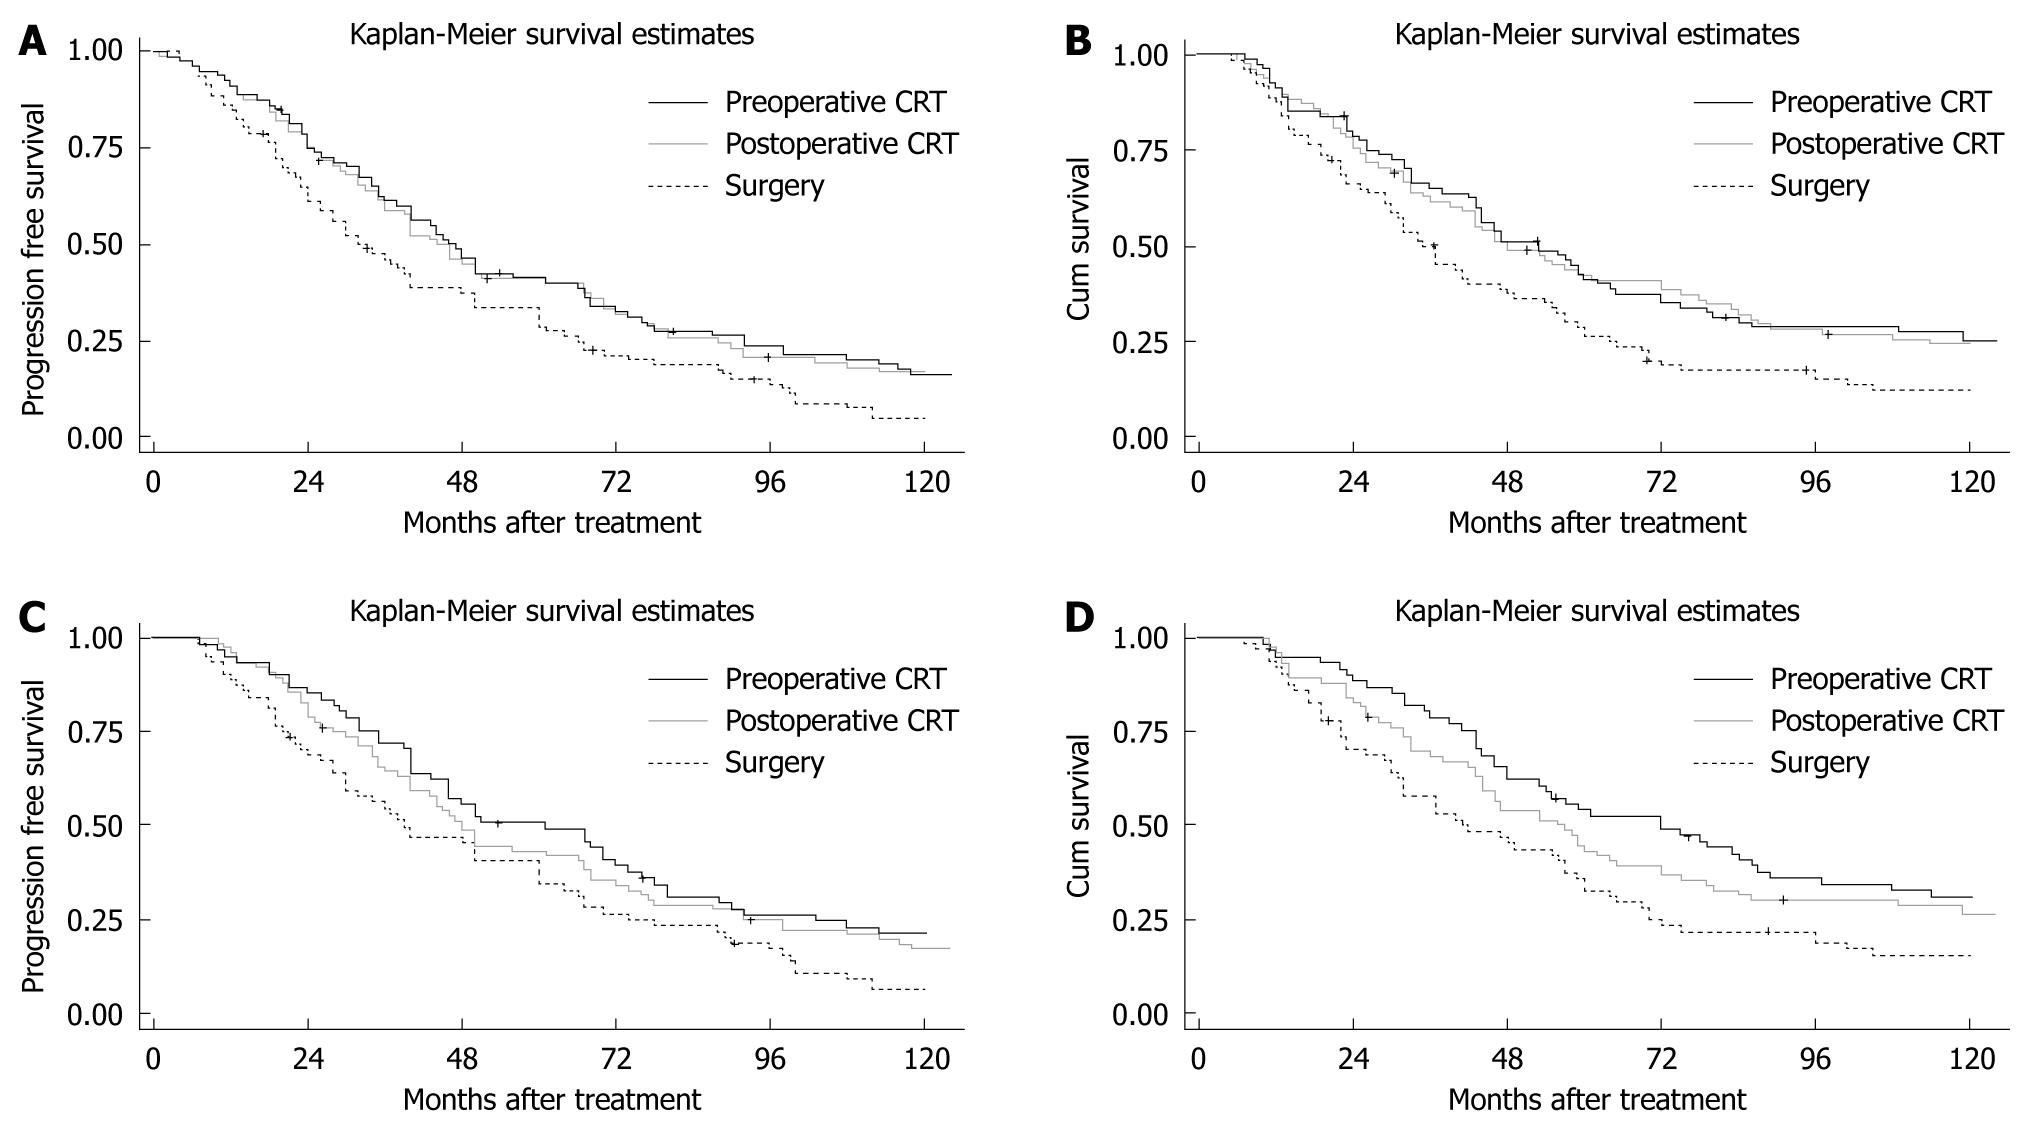
Figure 1 Kaplan-Meier curves.
A: Postoperative progression-free survival. Logrank test: χ2 = 8.39, P = 0.0151; “+”: Loss to follow-up. Preoperative vs surgery: χ2 = 6.81, P = 0.0091; Postoperative vs surgery: χ2 = 5.38, P = 0.0203; Preoperative vs postoperative: χ2 = 0.14, P = 0.7060; B: Postoperative overall survival. Logrank: χ2 = 8.07, P = 0.0176; “+”: Loss to follow-up. Preoperative vs surgery: χ2 = 7.85, P = 0.0051; Postoperative vs surgery: χ2 = 5.33, P = 0.0209; Preoperative vs postoperative: χ2 = 0.46, P = 0.4978; C: Postoperative progression-free survival of radical resection. Logrank: χ2 = 6.82, P = 0.0331; “+”: Loss to follow-up. Preoperative vs surgery: χ2 = 6.16, P = 0.0130; Postoperative vs surgery: χ2 = 4.02, P = 0.0449; Preoperative vs postoperative: χ2 = 0.22, P = 0.6416; D: Postoperative overall survival of radical resection. Logrank: χ2 = 8.36, P = 0.0153; “+”: Loss to follow-up. Preoperative vs surgery: χ2 = 7.65, P = 0.0057; Postoperative vs surgery: χ2 = 4.78, P = 0.0288; Preoperative vs postoperative: χ2 = 0.16, P = 0.6873.
- Citation: Lv J, Cao XF, Zhu B, Ji L, Tao L, Wang DD. Long-term efficacy of perioperative chemoradiotherapy on esophageal squamous cell carcinoma. World J Gastroenterol 2010; 16(13): 1649-1654
- URL: https://www.wjgnet.com/1007-9327/full/v16/i13/1649.htm
- DOI: https://dx.doi.org/10.3748/wjg.v16.i13.1649


