Copyright
©2010 Baishideng.
World J Gastroenterol. Mar 28, 2010; 16(12): 1458-1464
Published online Mar 28, 2010. doi: 10.3748/wjg.v16.i12.1458
Published online Mar 28, 2010. doi: 10.3748/wjg.v16.i12.1458
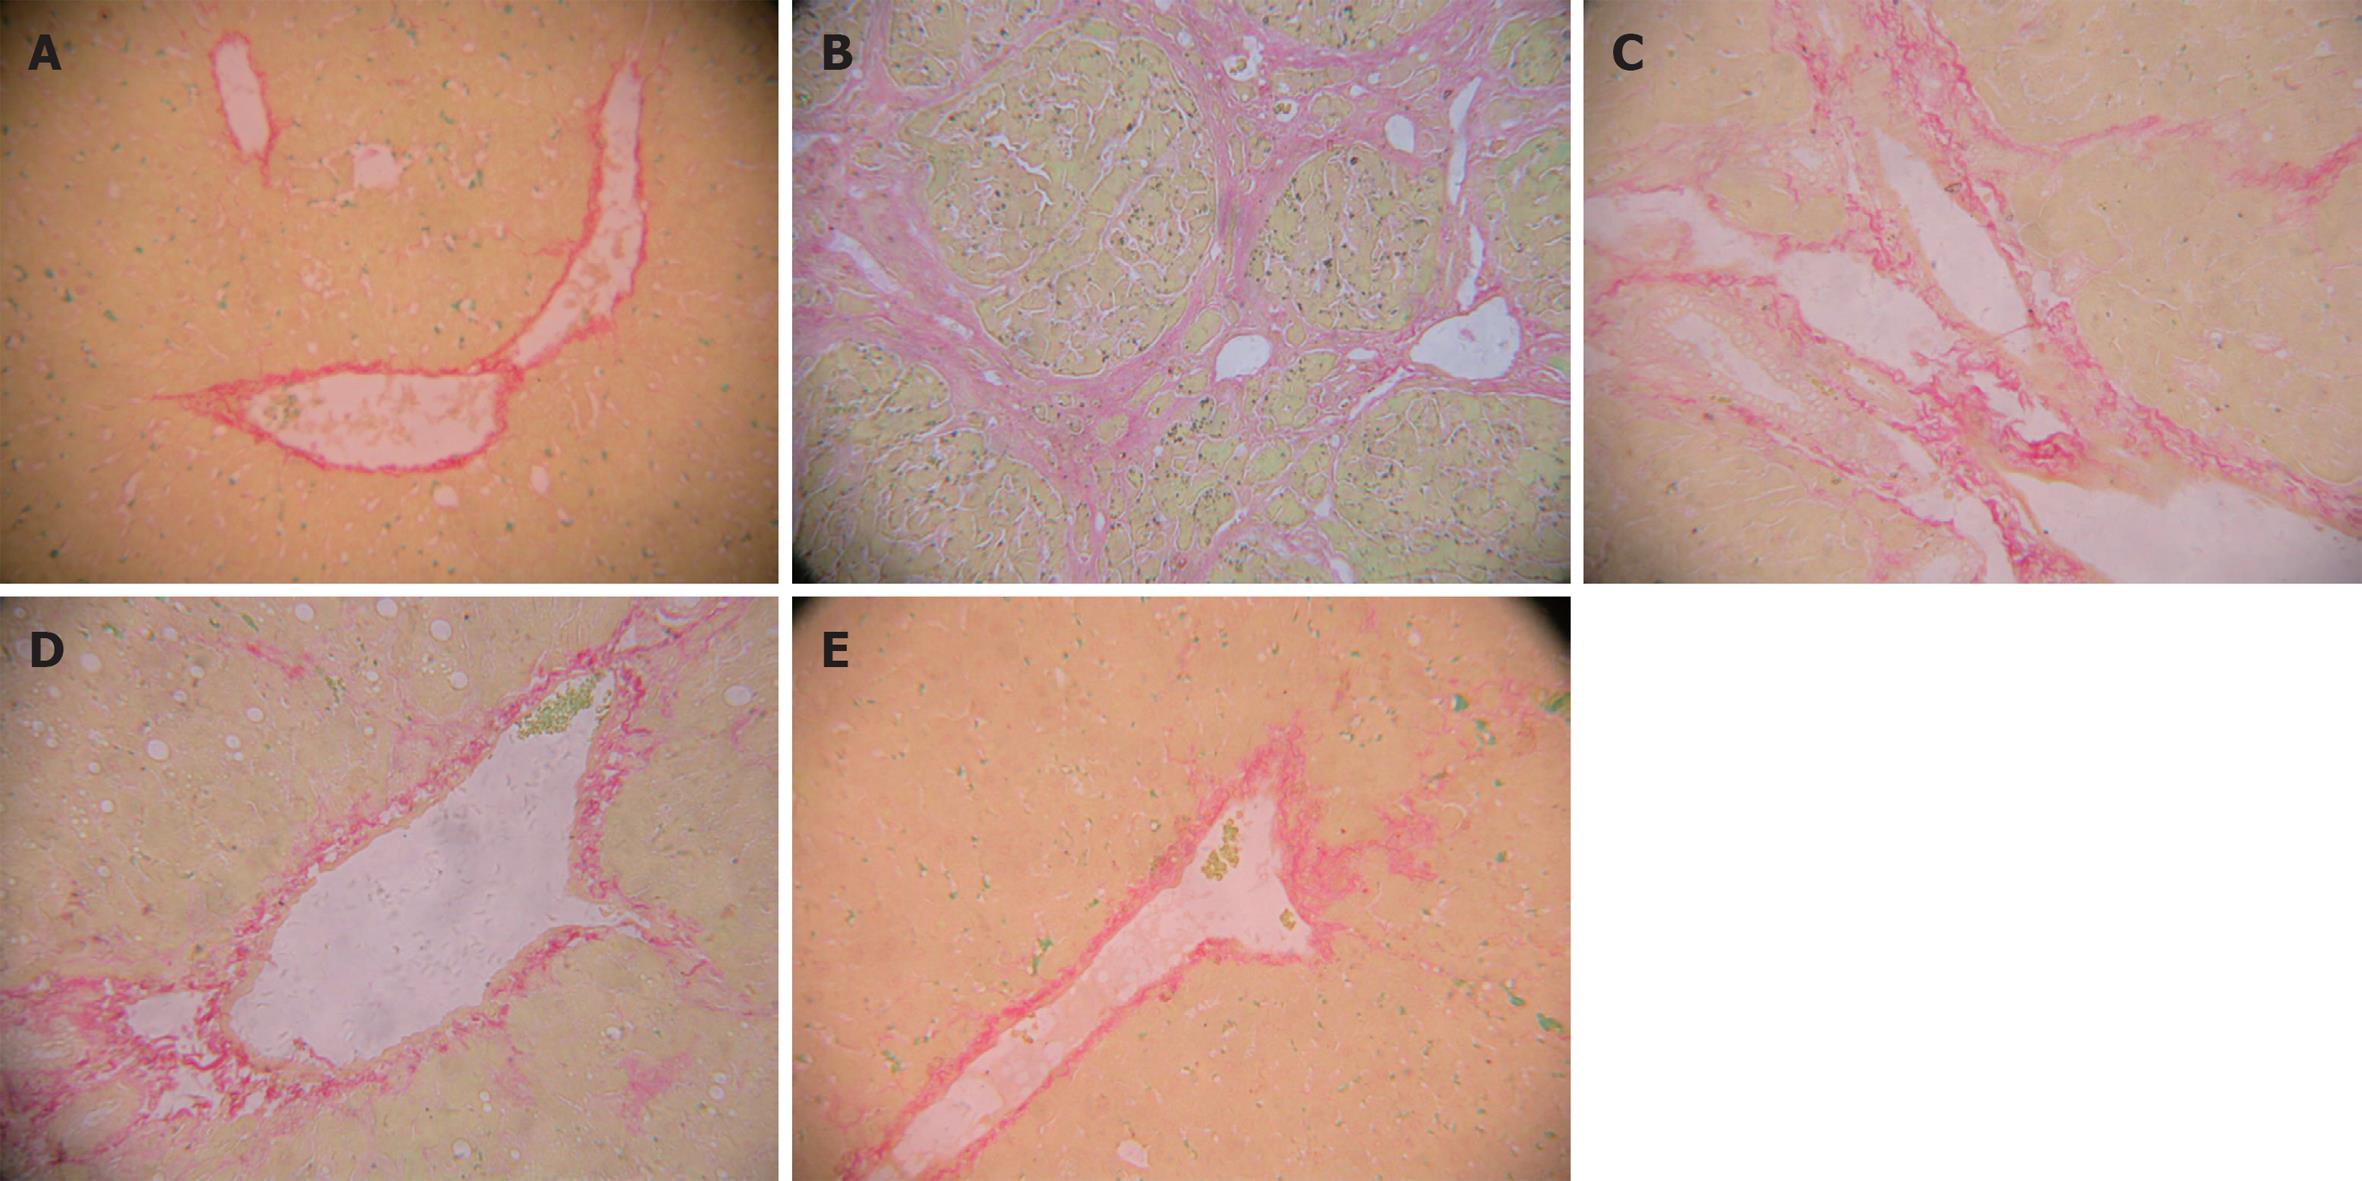
Figure 2 Profiles of liver tissues in rats.
A: Normal rats; B: Rats with hepatic fibrosis; C: Low-dosage of HYRD-treated rats; D: Medium-dosage of HYRD-treated rats; E: High-dosage of HYRD-treated rats. Stained with ponceau’s, × 100.
-
Citation: Yang FR, Fang BW, Lou JS. Effects of
Haobie Yangyin Ruanjian Decoction on hepatic fibrosis induced by carbon tetrachloride in rats. World J Gastroenterol 2010; 16(12): 1458-1464 - URL: https://www.wjgnet.com/1007-9327/full/v16/i12/1458.htm
- DOI: https://dx.doi.org/10.3748/wjg.v16.i12.1458


