Copyright
©2009 The WJG Press and Baishideng.
World J Gastroenterol. Mar 7, 2009; 15(9): 1113-1118
Published online Mar 7, 2009. doi: 10.3748/wjg.15.1113
Published online Mar 7, 2009. doi: 10.3748/wjg.15.1113
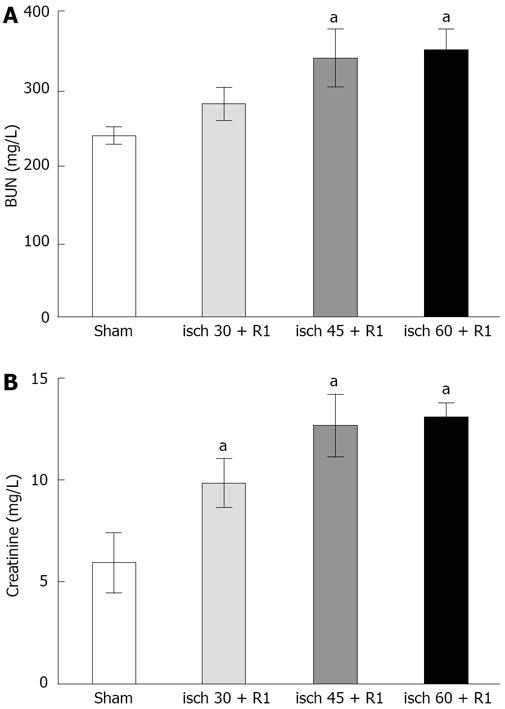
Figure 1 Alterations in renal function during different renal I/R periods.
A: BUN; B: Plasma creatinine. The data are presented as mean ± SE. aP < 0.05 vs sham-operated group. All ischemic periods were followed by 1 h reperfusion.
- Citation: Kadkhodaee M, Golab F, Zahmatkesh M, Ghaznavi R, Hedayati M, Arab HA, Ostad SN, Soleimani M. Effects of different periods of renal ischemia on liver as a remote organ. World J Gastroenterol 2009; 15(9): 1113-1118
- URL: https://www.wjgnet.com/1007-9327/full/v15/i9/1113.htm
- DOI: https://dx.doi.org/10.3748/wjg.15.1113


