Copyright
©2009 The WJG Press and Baishideng.
World J Gastroenterol. Dec 28, 2009; 15(48): 6117-6122
Published online Dec 28, 2009. doi: 10.3748/wjg.15.6117
Published online Dec 28, 2009. doi: 10.3748/wjg.15.6117
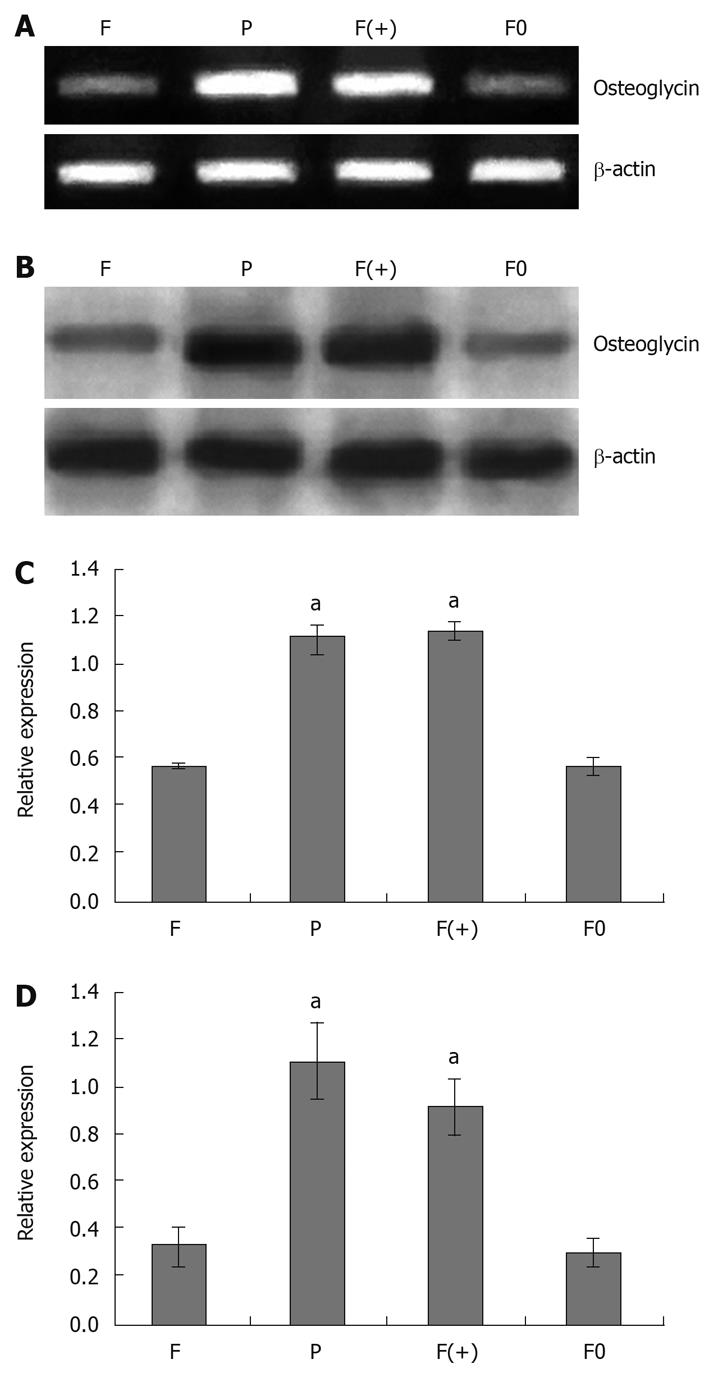
Figure 1 Analysis of osteoglycin expression.
RT-PCR analysis (A) and Western blot analysis (B) of osteoglycin expression in mouse hepatocarcinoma cells; relative signal intensities of osteoglycin mRNA (C) and protein (D) levels were normal as against those of β-actin by LabWorks (UVP GDS-800 Version 4.0) analysis (compared with F cells, aP < 0.05). F: Hca-F cells; P: Hca-P cells; F(+): Hca-F cells transfected with pIRESpuro3 osteoglycin(+); F0: Hca-F cells transfected with pIRESpuro3. β-actin was used as an internal control.
- Citation: Cui XN, Tang JW, Song B, Wang B, Chen SY, Hou L. High expression of osteoglycin decreases gelatinase activity of murine hepatocarcinoma Hca-F cells. World J Gastroenterol 2009; 15(48): 6117-6122
- URL: https://www.wjgnet.com/1007-9327/full/v15/i48/6117.htm
- DOI: https://dx.doi.org/10.3748/wjg.15.6117


