Copyright
©2009 The WJG Press and Baishideng.
World J Gastroenterol. Dec 28, 2009; 15(48): 6034-6043
Published online Dec 28, 2009. doi: 10.3748/wjg.15.6034
Published online Dec 28, 2009. doi: 10.3748/wjg.15.6034
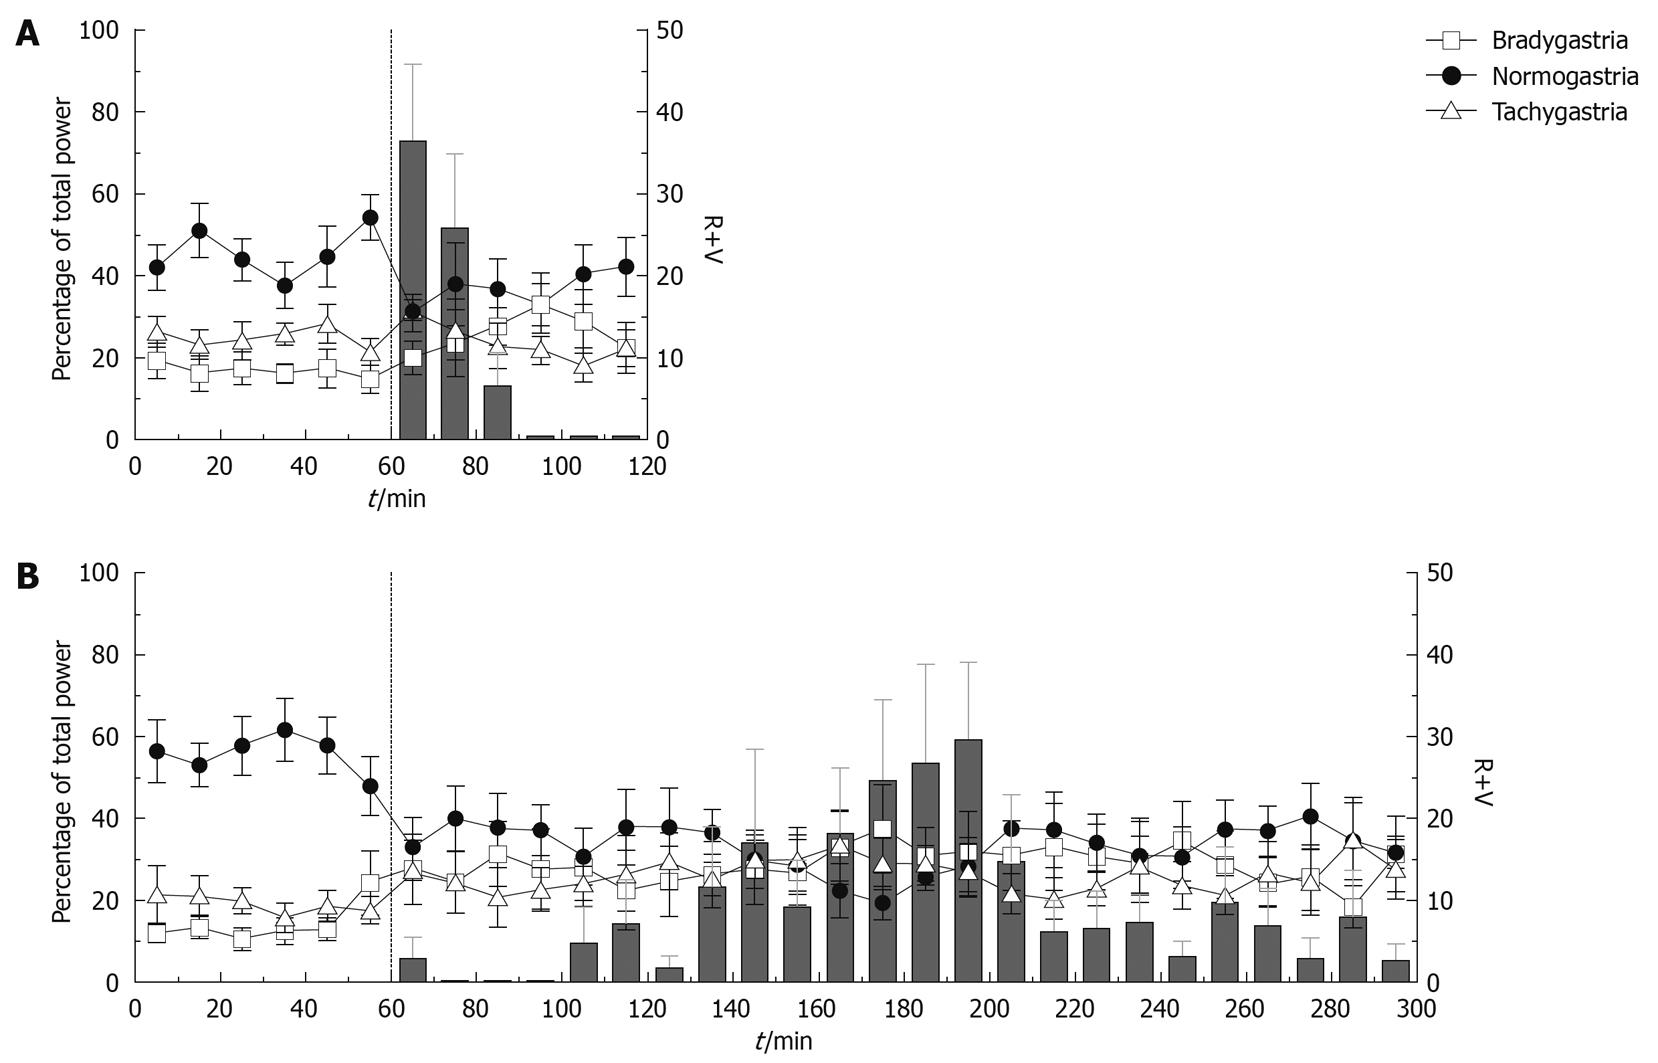
Figure 4 Profile of emesis and GMA repartition in the bradygastric, normogastric and tachygastric ranges following the administration of apomorphine (0.
25 mg/kg sc) (A) and cisplatin (10 mg/kg ip) (B) in the ferret. Data plotted as mean ± SE per 10 min, n = 8.
- Citation: Percie du Sert N, Chu KM, Wai MK, Rudd JA, Andrews PL. Reduced normogastric electrical activity associated with emesis: A telemetric study in ferrets. World J Gastroenterol 2009; 15(48): 6034-6043
- URL: https://www.wjgnet.com/1007-9327/full/v15/i48/6034.htm
- DOI: https://dx.doi.org/10.3748/wjg.15.6034


