Copyright
©2009 The WJG Press and Baishideng.
World J Gastroenterol. Dec 28, 2009; 15(48): 6034-6043
Published online Dec 28, 2009. doi: 10.3748/wjg.15.6034
Published online Dec 28, 2009. doi: 10.3748/wjg.15.6034
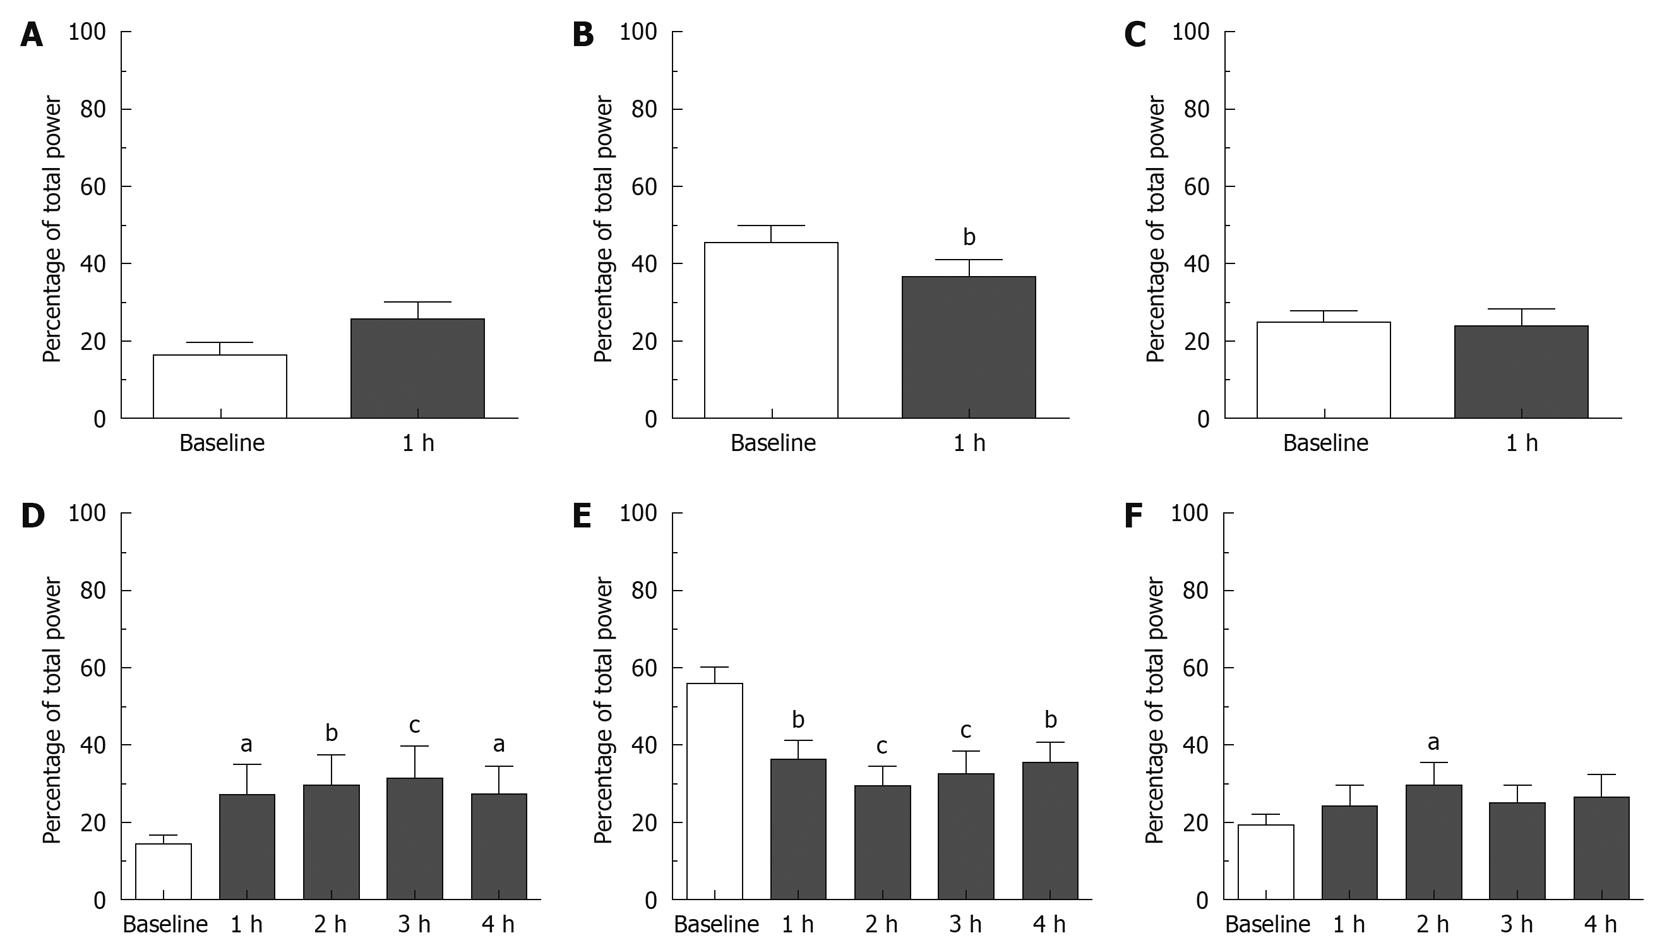
Figure 3 Effect of apomorphine (0.
25 mg/kg sc, A-C) and cisplatin (10 mg/kg ip, D-F) on the gastric myoelectric activity (GMA) in ferrets. The graphs represent the percentage of total (0-18 cpm) power in the bradygastric range [0 - (DF - 1 cpm), A and D], in the normogastric range [(DF - 1 cpm) - (DF + 1 cpm), B and E] and in the tachygastric range [(DF + 1 cpm) - 15 cpm, C and F]. Results are plotted as mean ± SE (n = 8). Differences compared to the effect of a dose of saline (sc or ip as appropriate, data not shown on this graph) were computed using two-way ANOVA (factors: treatment and time) and Bonferroni post-tests, Differences with baseline are indicated as aP < 0.05, bP < 0.01, cP < 0.001.
- Citation: Percie du Sert N, Chu KM, Wai MK, Rudd JA, Andrews PL. Reduced normogastric electrical activity associated with emesis: A telemetric study in ferrets. World J Gastroenterol 2009; 15(48): 6034-6043
- URL: https://www.wjgnet.com/1007-9327/full/v15/i48/6034.htm
- DOI: https://dx.doi.org/10.3748/wjg.15.6034


