Copyright
©2009 The WJG Press and Baishideng.
World J Gastroenterol. Dec 28, 2009; 15(48): 6034-6043
Published online Dec 28, 2009. doi: 10.3748/wjg.15.6034
Published online Dec 28, 2009. doi: 10.3748/wjg.15.6034
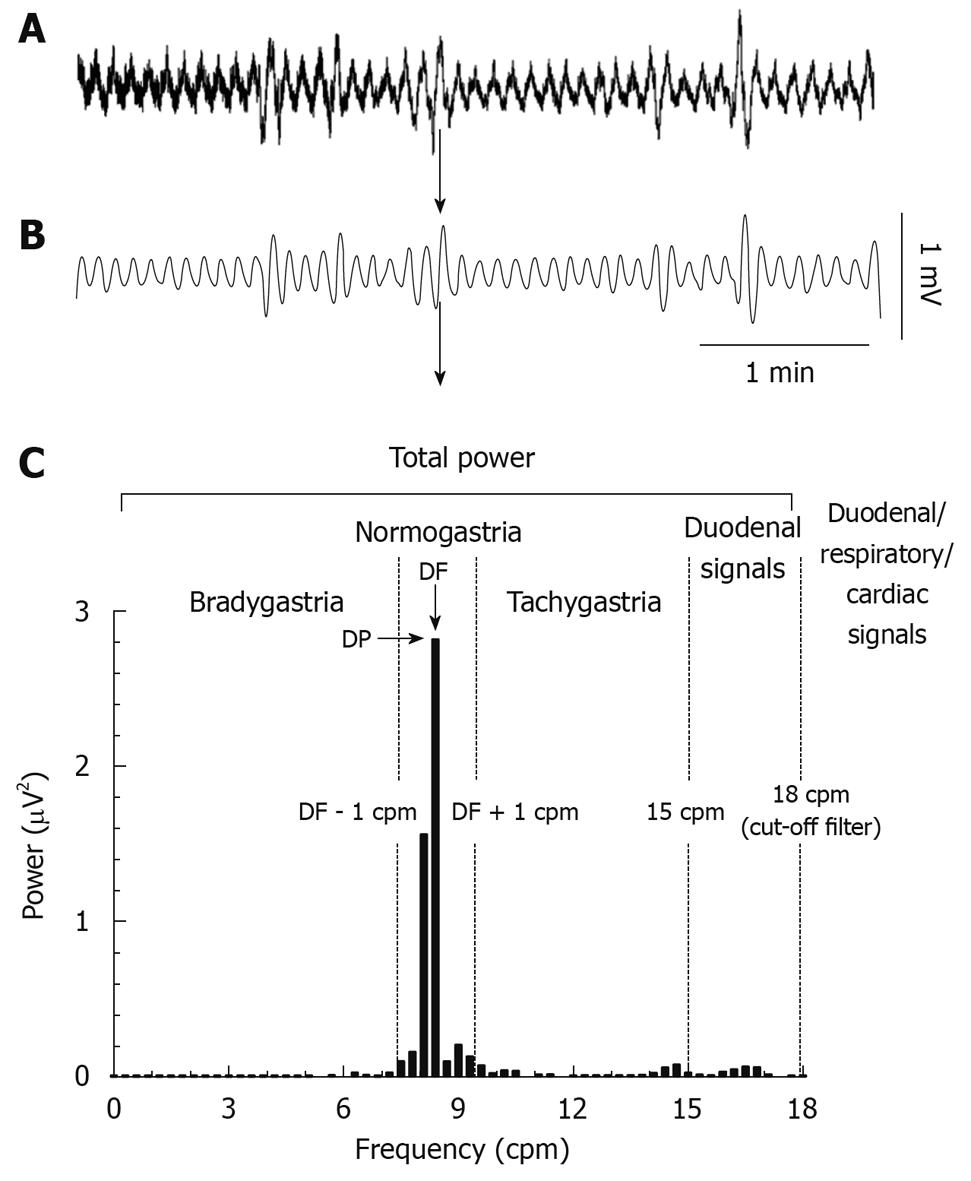
Figure 1 Telemetric recordings of the ferret gastric myoelectric activity and spectral analysis.
A: The raw trace sampled at 1 kHz; B: The same trace after filtering (low pass filter, cut-off: 0.3 Hz; sampling frequency 10 Hz); C: The fast Fourier transform of the same 5 min of data (Hann window, 2048). DF: Dominant frequency; DP: Dominant power; cpm: Counts/min; Total power: Total power contained in all the frequency bins between 0 and 18 cpm.
- Citation: Percie du Sert N, Chu KM, Wai MK, Rudd JA, Andrews PL. Reduced normogastric electrical activity associated with emesis: A telemetric study in ferrets. World J Gastroenterol 2009; 15(48): 6034-6043
- URL: https://www.wjgnet.com/1007-9327/full/v15/i48/6034.htm
- DOI: https://dx.doi.org/10.3748/wjg.15.6034


