Copyright
©2009 The WJG Press and Baishideng.
World J Gastroenterol. Dec 14, 2009; 15(46): 5813-5820
Published online Dec 14, 2009. doi: 10.3748/wjg.15.5813
Published online Dec 14, 2009. doi: 10.3748/wjg.15.5813
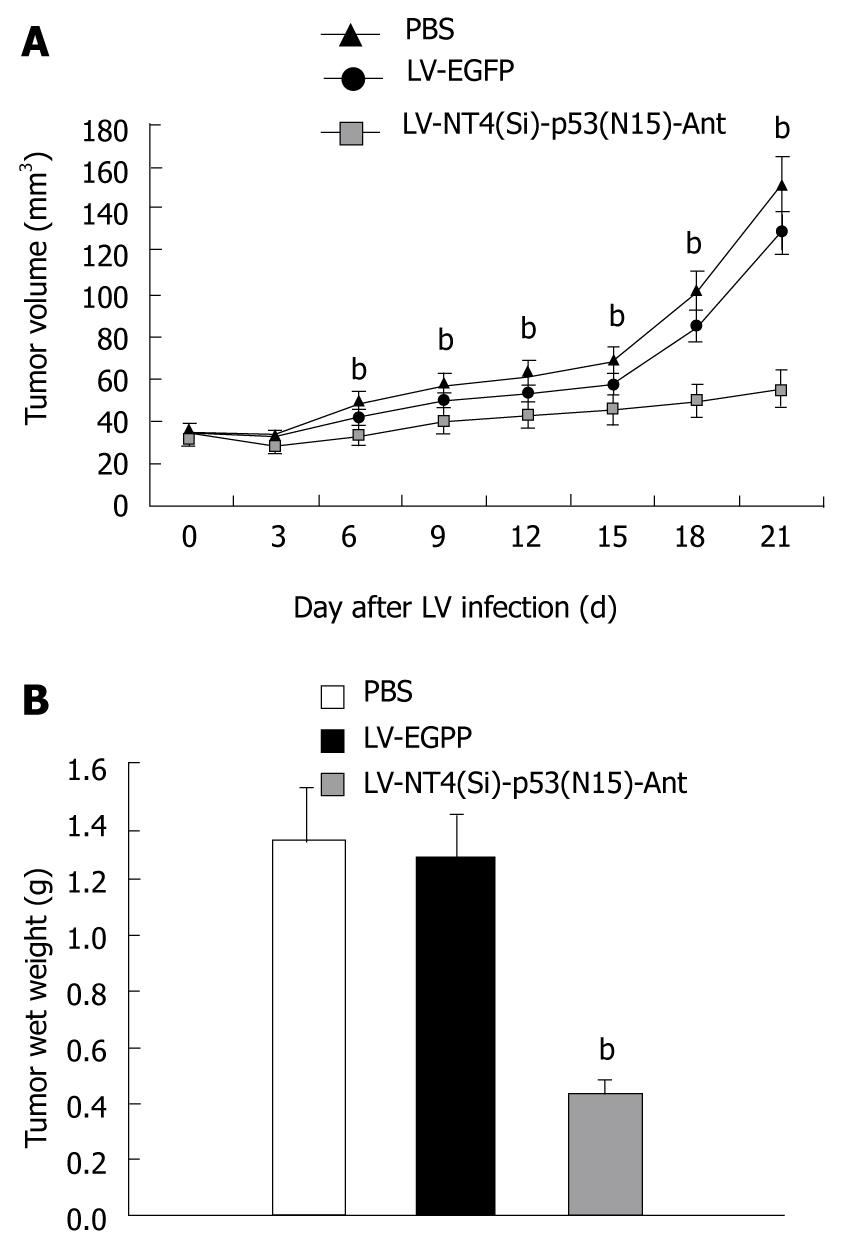
Figure 7 Tumor growth curve (A) and tumor wet weight (B) after treatment with LV-NT4(Si)-p53(N15)-Ant.
A: Tumor growth curve after treatment with LV-NT4(Si)-p53(N15)-Ant. Tumors grew rapidly in the PBS and LV-EGFP groups, while the tumor growth was significantly inhibited in the LV-NT4(Si)-p53(N15)-Ant group 3 wk after infection. There was no statistical significance between the PBS group (151.0 ± 50.1 mm3) and the LV-EGFP group (128.5 ± 45.3 mm3) in terms of tumor volume (P > 0.05). But the tumor volume in the LV-NT4(Si)-p53(N15)-Ant group (55.1 ± 18.7 mm3) was significantly less than that of the PBS and LV-EGFP groups (bP < 0.01); B: Tumor wet weight after treatment with LV-NT4(Si)-p53(N15)-Ant. There were no significant differences in the wet weight of tumors between the two control groups: PBS group 1.33 ± 0.93 g vs LV-EGFP group 1.27 ± 1.04 g (P > 0.05). But the wet weight of the LV-NT4(Si)-p53(N15)-Ant treatment group (0.43 ± 0.77 g) was significantly less than that of the two control groups (bP < 0.01).
- Citation: Song LP, Li YP, Wang N, Li WW, Ren J, Qiu SD, Wang QY, Yang GX. NT4(Si)-p53(N15)-antennapedia induces cell death in a human hepatocellular carcinoma cell line. World J Gastroenterol 2009; 15(46): 5813-5820
- URL: https://www.wjgnet.com/1007-9327/full/v15/i46/5813.htm
- DOI: https://dx.doi.org/10.3748/wjg.15.5813


