Copyright
©2009 The WJG Press and Baishideng.
World J Gastroenterol. Dec 14, 2009; 15(46): 5813-5820
Published online Dec 14, 2009. doi: 10.3748/wjg.15.5813
Published online Dec 14, 2009. doi: 10.3748/wjg.15.5813
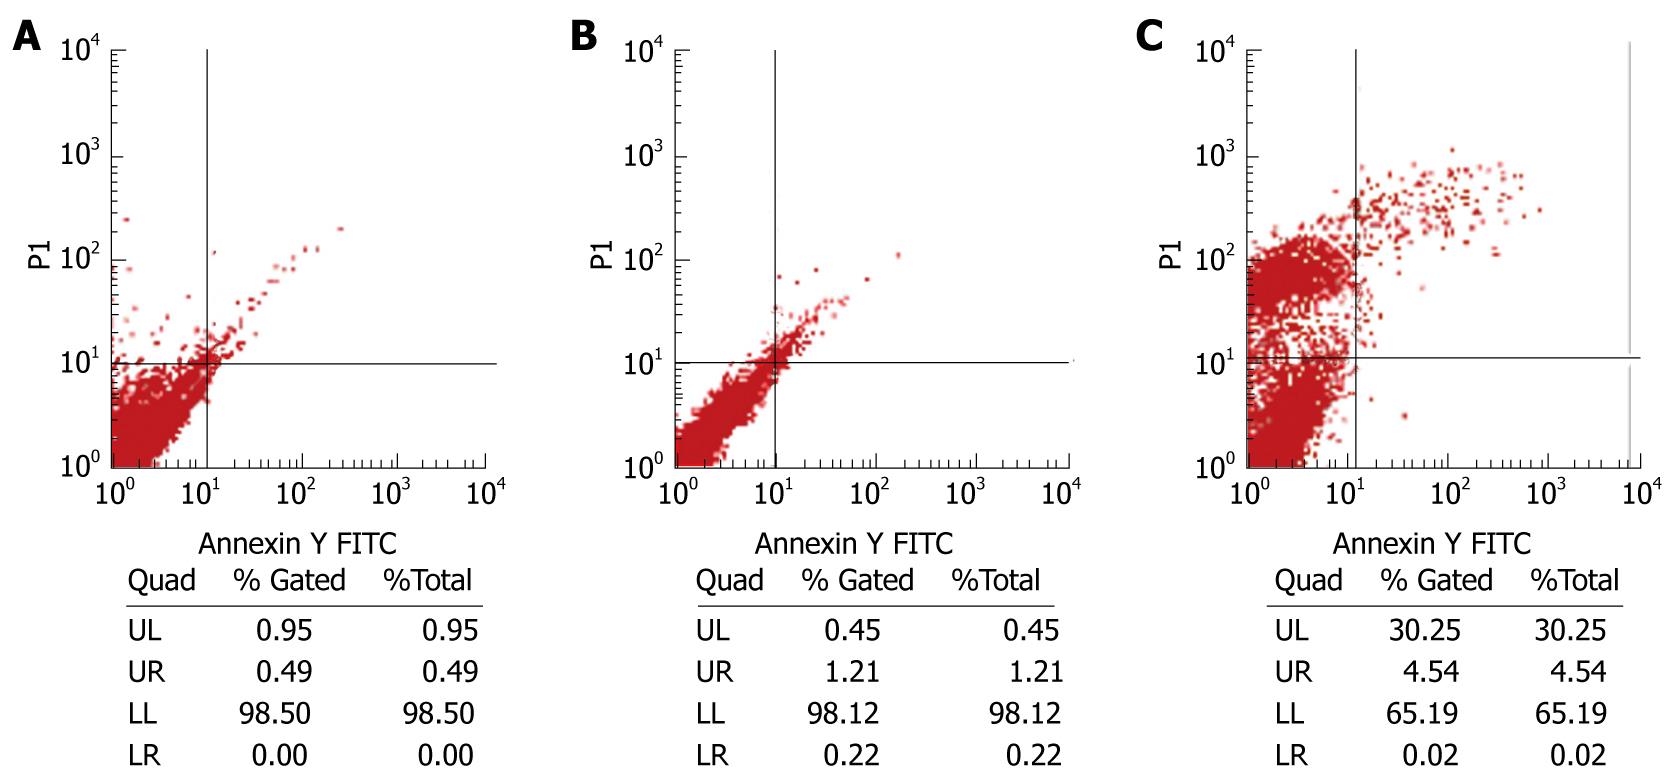
Figure 6 Flow cytometry analysis of HepG2 cells without treatment (A), 48 h after infection with LV-EGFP (B) and LV-NT4(Si)-p53(N15)-Ant (C) after stained with Annexin V and propidium iodide.
The left lower quadrant represents normal cells (An-PI-), the right lower quadrant represents early apoptotic cells (An+ PI-), the right upper quadrant represents apoptotic cells and necrotic cells (An + PI +), the upper left quadrant represents early necrotic cells (An-PI +).
- Citation: Song LP, Li YP, Wang N, Li WW, Ren J, Qiu SD, Wang QY, Yang GX. NT4(Si)-p53(N15)-antennapedia induces cell death in a human hepatocellular carcinoma cell line. World J Gastroenterol 2009; 15(46): 5813-5820
- URL: https://www.wjgnet.com/1007-9327/full/v15/i46/5813.htm
- DOI: https://dx.doi.org/10.3748/wjg.15.5813


