Copyright
©2009 The WJG Press and Baishideng.
World J Gastroenterol. Dec 14, 2009; 15(46): 5813-5820
Published online Dec 14, 2009. doi: 10.3748/wjg.15.5813
Published online Dec 14, 2009. doi: 10.3748/wjg.15.5813
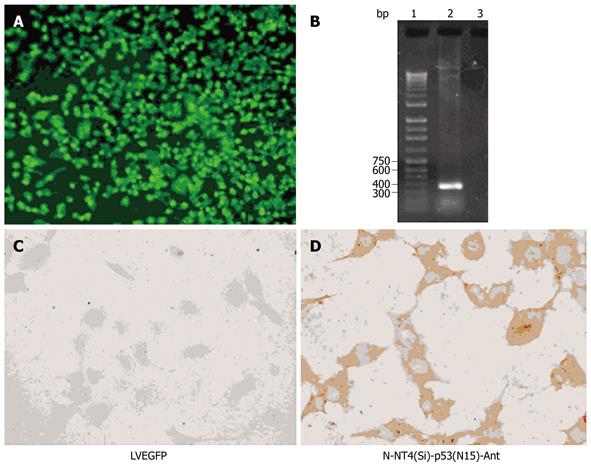
Figure 2 Fluorescent microscopic analysis and immunohistochemical staining.
Fluorescence microscopy analysis showing EGFP expression in HepG2 cells (A), agarose gel electrophoresis of RT-PCR products from HepG2 cells (B) [lane 1: 1.0 kb DNA ladder; lane 2: RT-PCR products from cells infected with LV-NT4(Si)-p53(N15)-Ant; lane 3: negative controls infected with LV-EGFP], immunohistochemical staining showing no p53 protein (C), and p53 protein expression in cytoplasm of HepG2 cells (D) 48 h after infection with LV-NT4(Si)-p53(N15)-Ant.
- Citation: Song LP, Li YP, Wang N, Li WW, Ren J, Qiu SD, Wang QY, Yang GX. NT4(Si)-p53(N15)-antennapedia induces cell death in a human hepatocellular carcinoma cell line. World J Gastroenterol 2009; 15(46): 5813-5820
- URL: https://www.wjgnet.com/1007-9327/full/v15/i46/5813.htm
- DOI: https://dx.doi.org/10.3748/wjg.15.5813


