Copyright
©2009 The WJG Press and Baishideng.
World J Gastroenterol. Nov 14, 2009; 15(42): 5300-5306
Published online Nov 14, 2009. doi: 10.3748/wjg.15.5300
Published online Nov 14, 2009. doi: 10.3748/wjg.15.5300
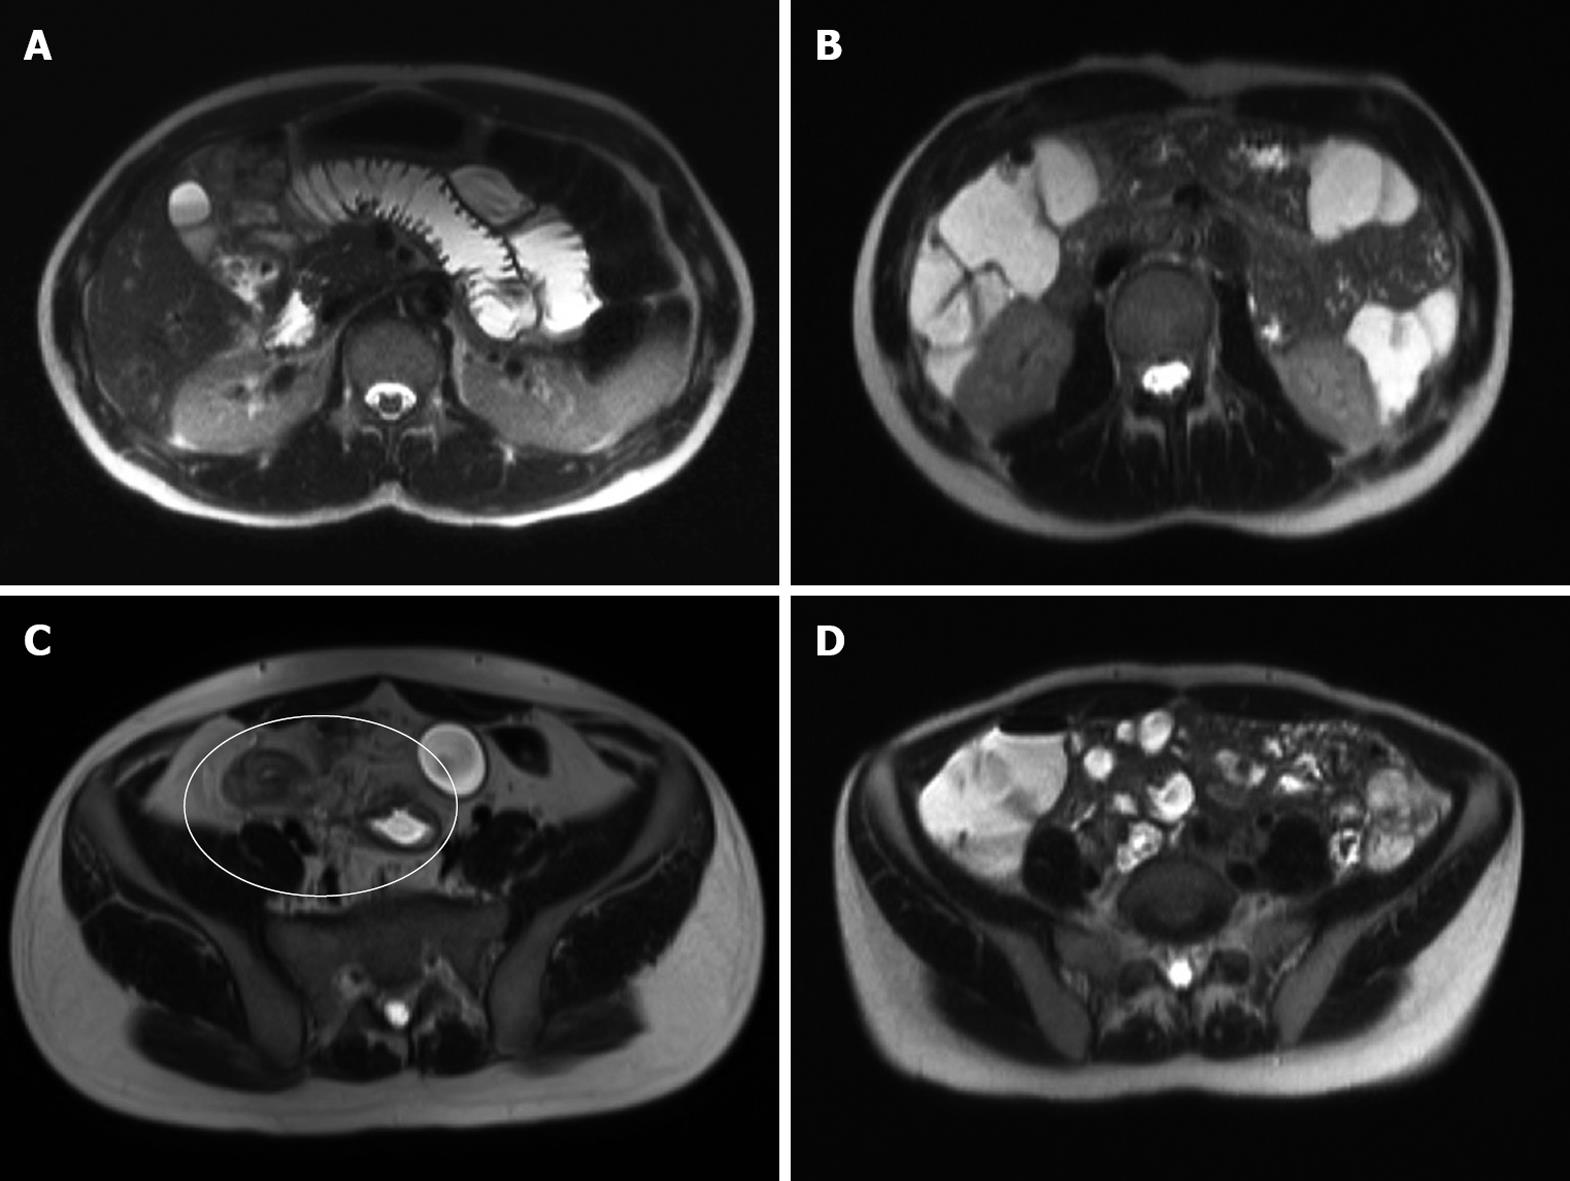
Figure 1 Images demonstrating good and poor proximal and distal small bowel (SB) distension.
A: Axial T2 weighted HASTE image of the upper abdomen demonstrating good proximal SB distension; B: Coronal T2 weighted HASTE image demonstrating poor proximal SB distension; C: Axial T2 weighted HASTE image of the lower abdomen demonstrating good distal SB distension, abnormal bowel thickening and fistulous tracts between the abnormal bowel loops (circled); D: Axial T2 weighted HASTE image of the lower abdomen demonstrating poor distal SB distension.
- Citation: Lawrance IC, Welman CJ, Shipman P, Murray K. Small bowel MRI enteroclysis or follow through: Which is optimal? World J Gastroenterol 2009; 15(42): 5300-5306
- URL: https://www.wjgnet.com/1007-9327/full/v15/i42/5300.htm
- DOI: https://dx.doi.org/10.3748/wjg.15.5300


