Copyright
©2009 The WJG Press and Baishideng.
World J Gastroenterol. Oct 14, 2009; 15(38): 4810-4815
Published online Oct 14, 2009. doi: 10.3748/wjg.15.4810
Published online Oct 14, 2009. doi: 10.3748/wjg.15.4810
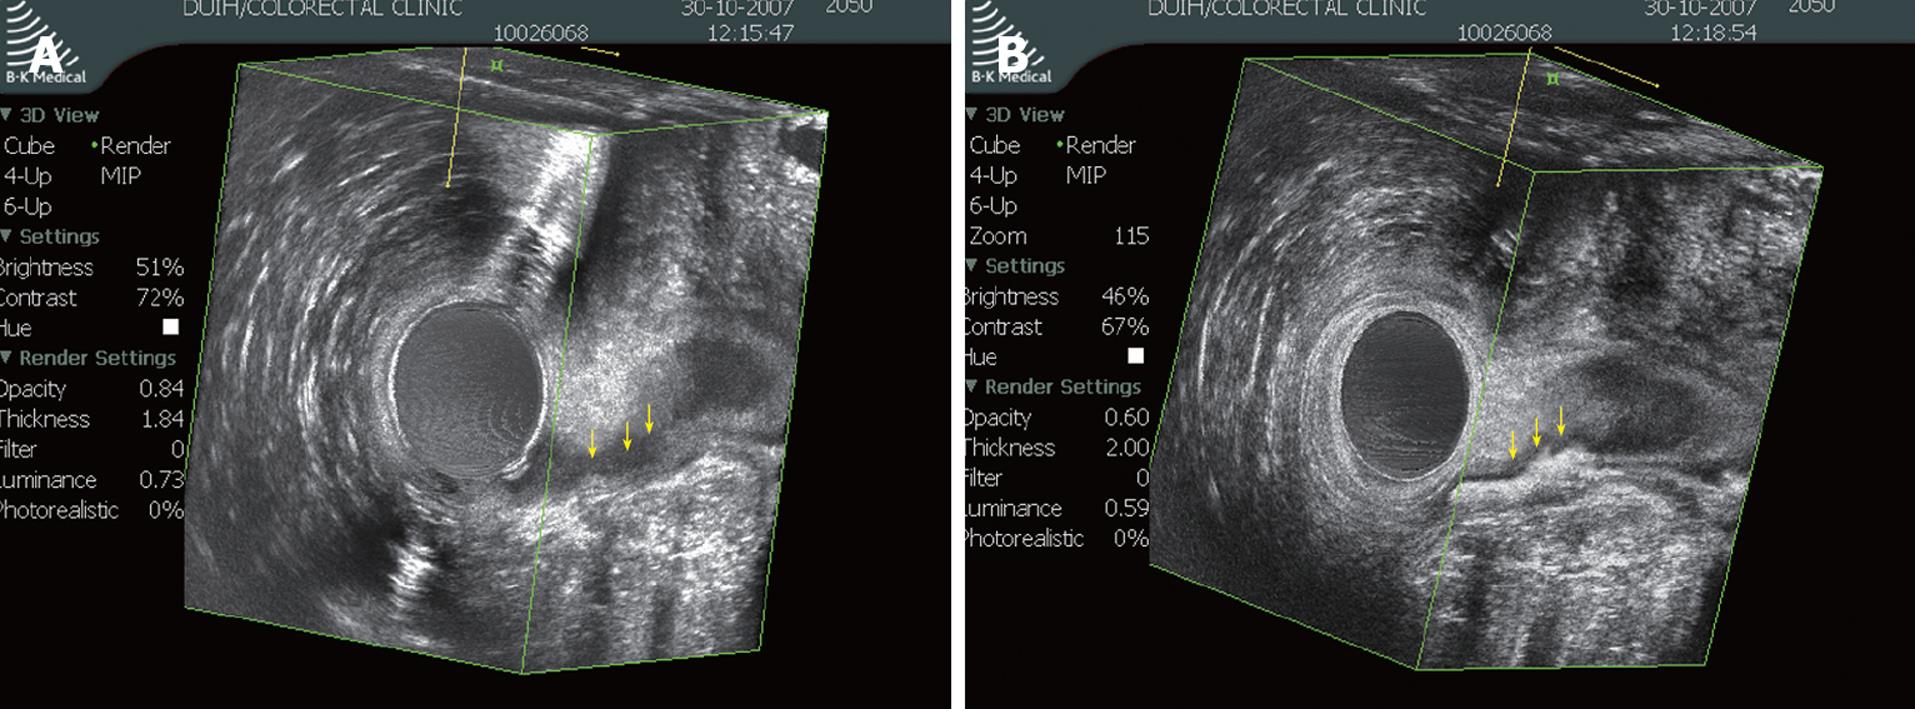
Figure 1 Pre-enhanced and H2O2 enhanced 3D-EAUS image of fistula tract in the same patient.
A: Hypoechoic fistula tract is seen at pre-enhanced scan (arrows); B: The fistula tract became hyperechoic due to the gas generated from H2O2; the tract is more clearly discriminated from adjacent tissue than at the pre-enhanced scan (arrows).
- Citation: Kim Y, Park YJ. Three-dimensional endoanal ultrasonographic assessment of an anal fistula with and without H2O2 enhancement. World J Gastroenterol 2009; 15(38): 4810-4815
- URL: https://www.wjgnet.com/1007-9327/full/v15/i38/4810.htm
- DOI: https://dx.doi.org/10.3748/wjg.15.4810


