Copyright
©2009 The WJG Press and Baishideng.
World J Gastroenterol. Sep 28, 2009; 15(36): 4499-4510
Published online Sep 28, 2009. doi: 10.3748/wjg.15.4499
Published online Sep 28, 2009. doi: 10.3748/wjg.15.4499
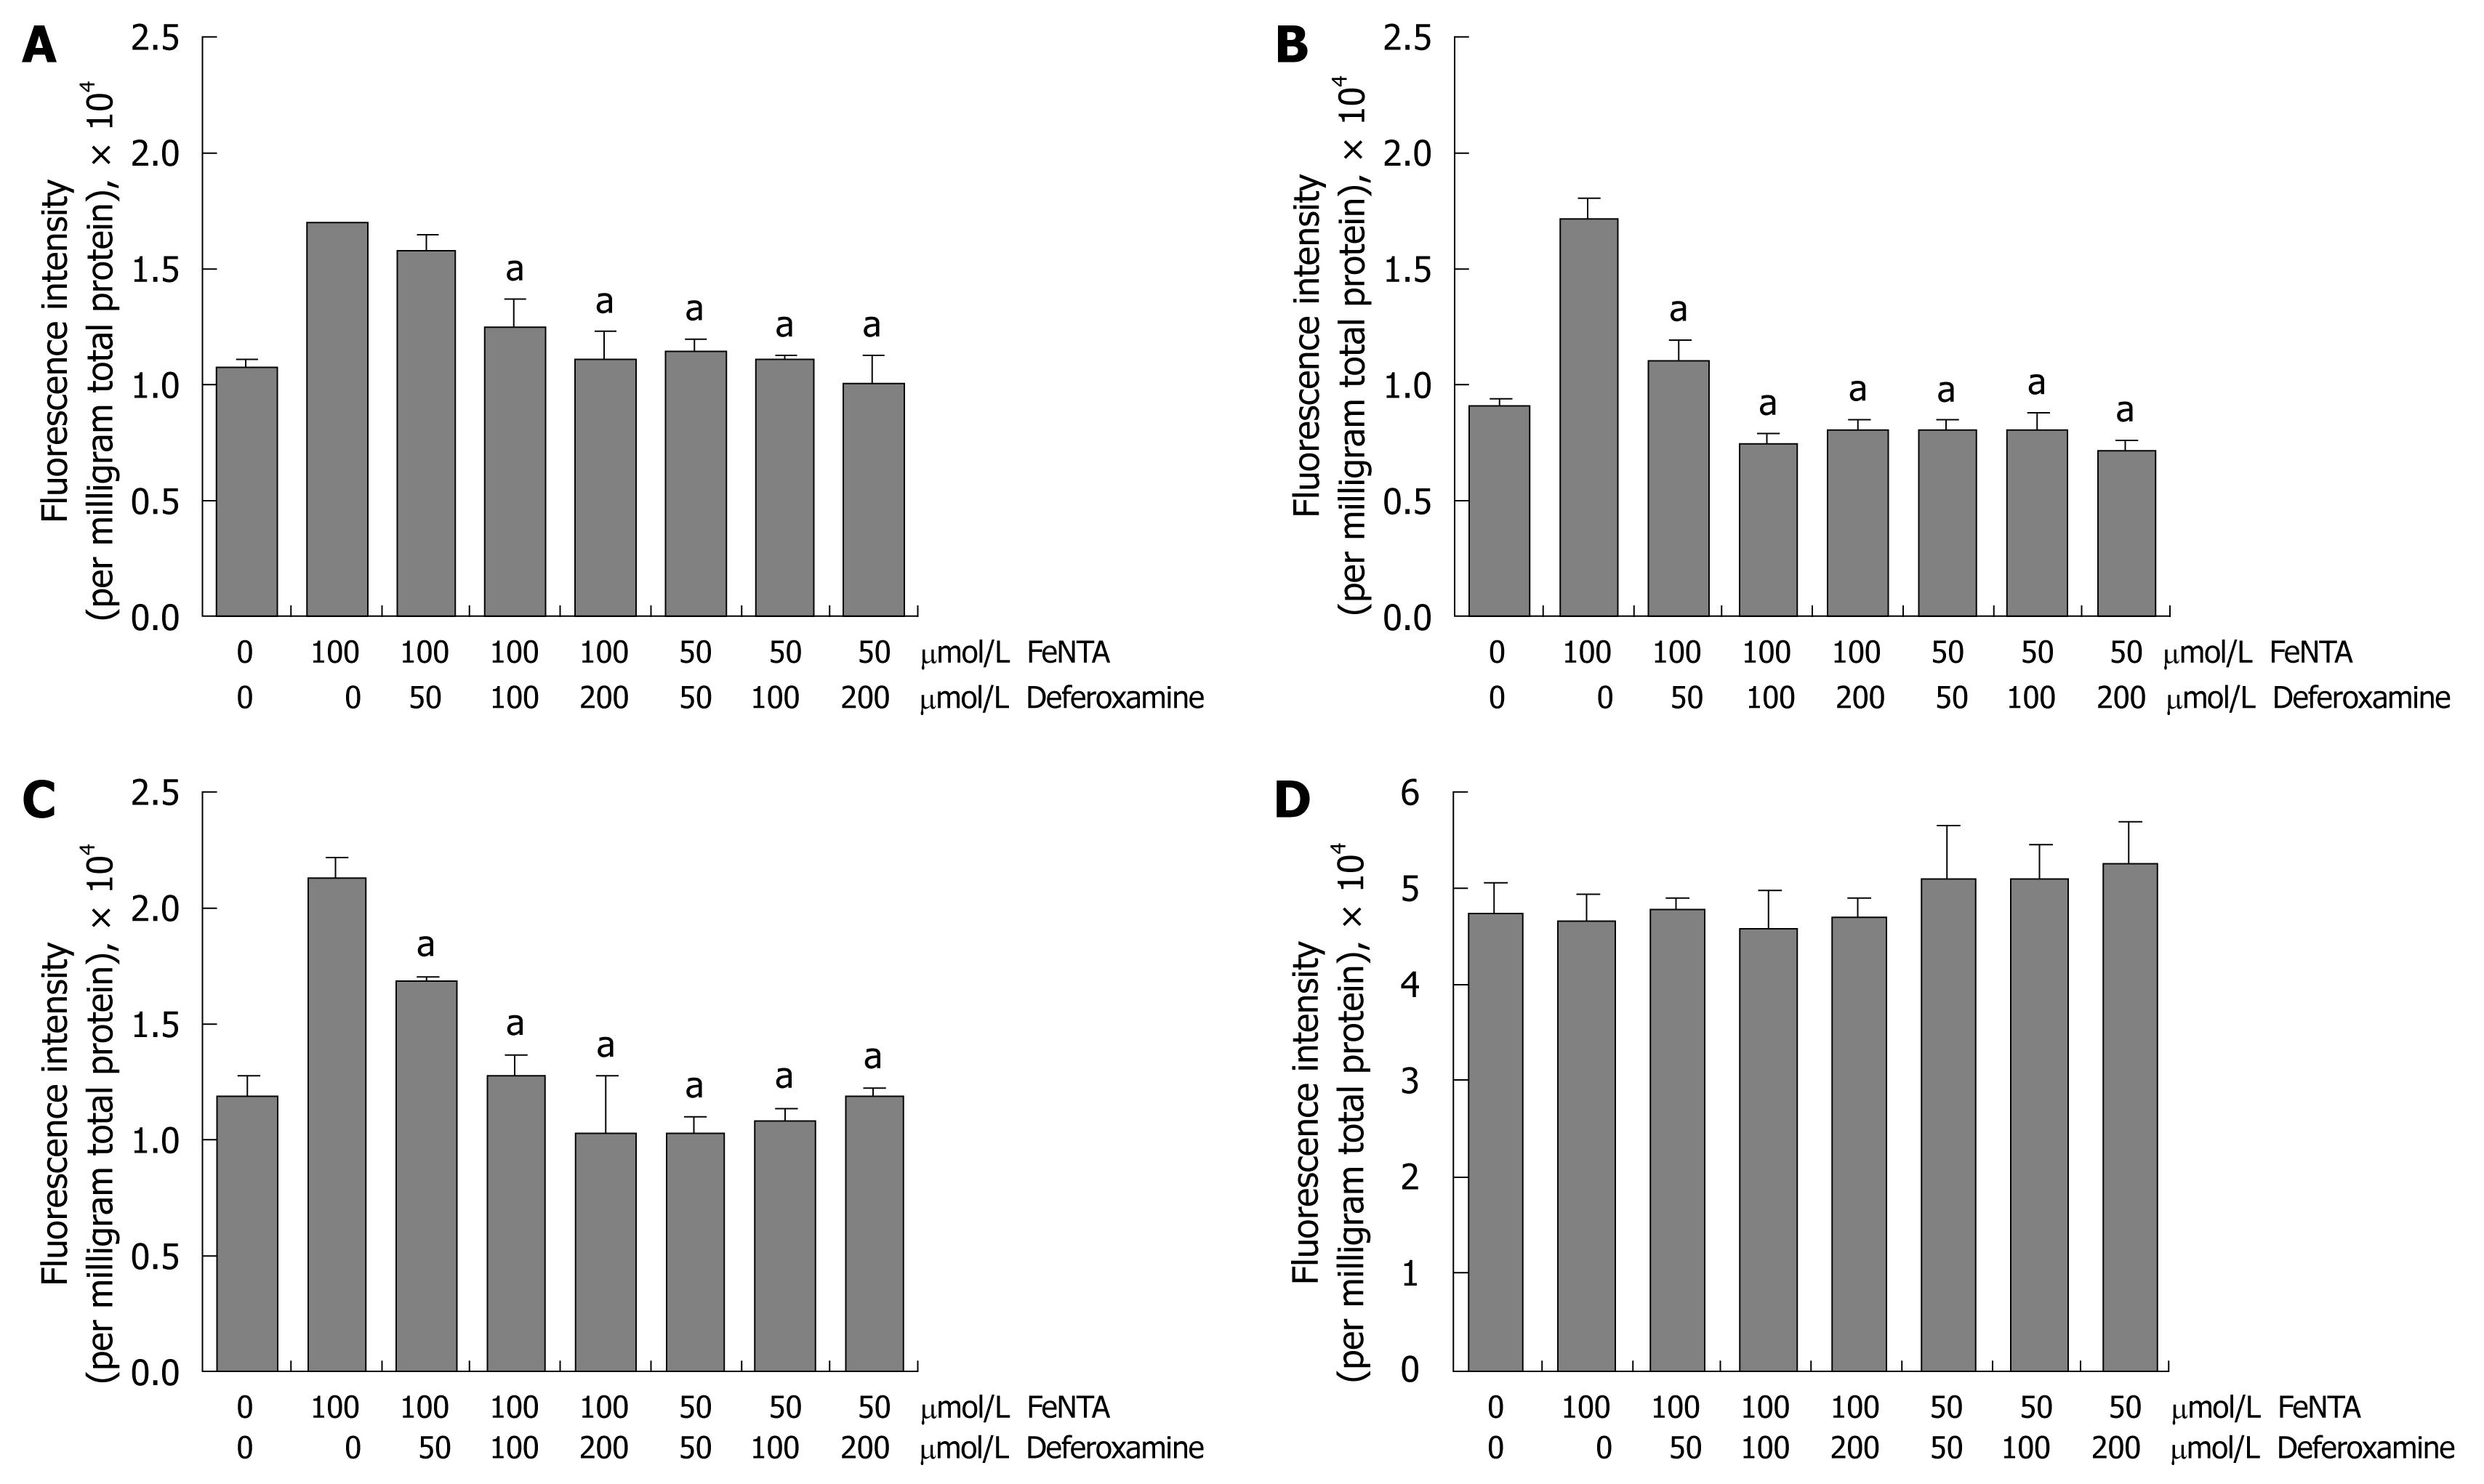
Figure 6 Effects of deferoxamine on intracellular ROS induced by FeNTA in Huh-7, 9-13, and CNS3 cells.
A: Fluorescence intensity with the H2DCF-DA probe in Huh-7 cells; B: Fluorescence intensity with the H2DCF-DA probe in 9-13 cells; C: Fluorescence intensity with the H2DCF-DA probe in CNS3 cells; D: Fluorescence intensity with the (control) DCF-DA in CNS3 cells. Cells were loaded with 100 μmol/L H2DCF-DA for 30 min, treated with different concentrations of deferoxamine (50, 100, 200 μmol/L) for 30 min, and then exposed to different concentrations of FeNTA (50, 100 μmol/L) for 1 h. Intracellular ROS production was measured as described in Materials and Methods.
- Citation: Hou WH, Rossi L, Shan Y, Zheng JY, Lambrecht RW, Bonkovsky HL. Iron increases HMOX1 and decreases hepatitis C viral expression in HCV-expressing cells. World J Gastroenterol 2009; 15(36): 4499-4510
- URL: https://www.wjgnet.com/1007-9327/full/v15/i36/4499.htm
- DOI: https://dx.doi.org/10.3748/wjg.15.4499


