Copyright
©2009 The WJG Press and Baishideng.
World J Gastroenterol. Aug 7, 2009; 15(29): 3621-3630
Published online Aug 7, 2009. doi: 10.3748/wjg.15.3621
Published online Aug 7, 2009. doi: 10.3748/wjg.15.3621
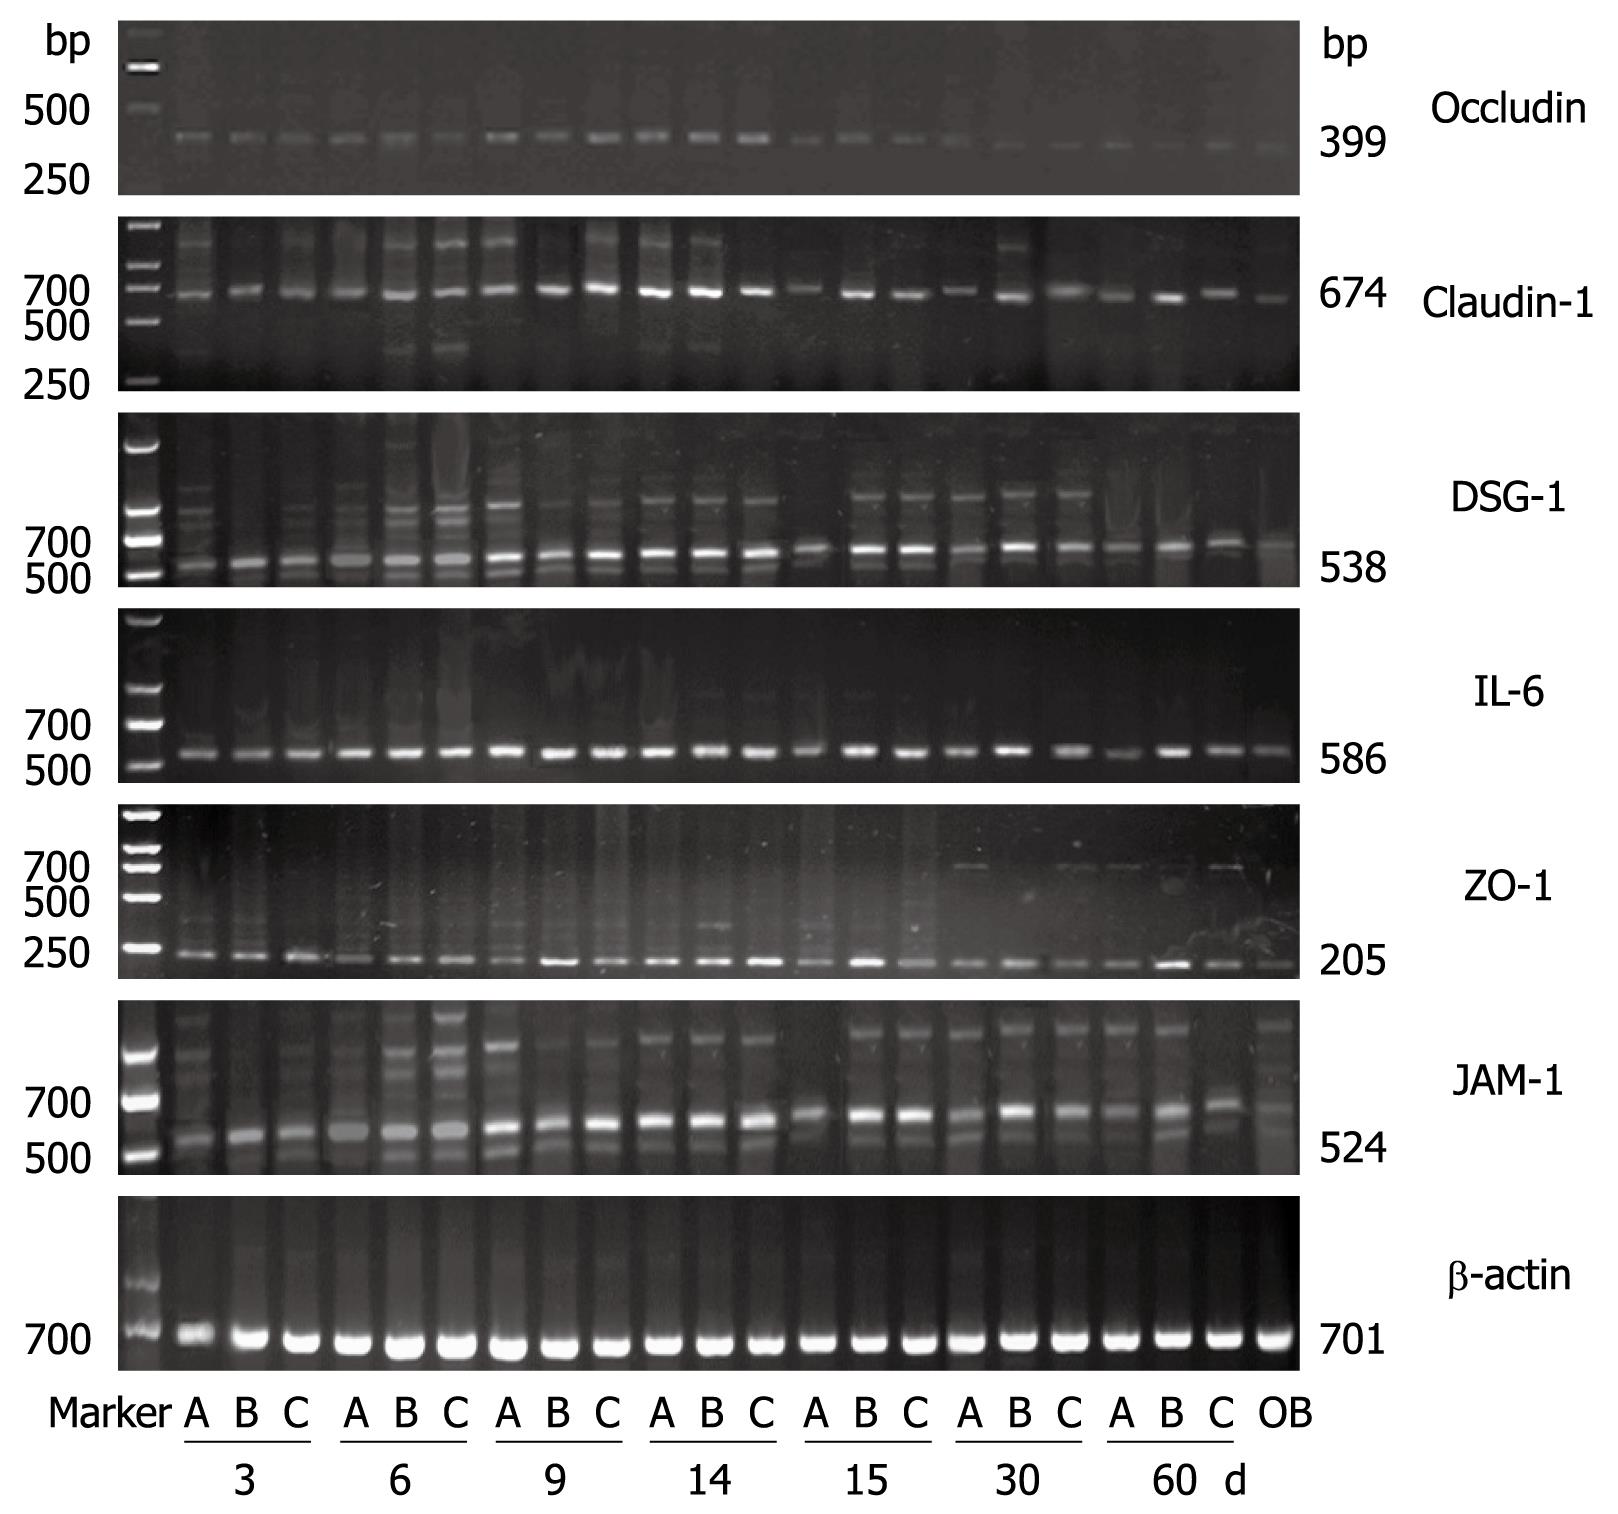
Figure 8 RT-PCR.
Samples from rats with 3, 6, 9, 14, 15, 30 and 60 d after operation. A: GER model; B: DER model; C: DG-ER model; OB: Samples from control rats (n = 5).
- Citation: Li FY, Li Y. Interleukin-6, desmosome and tight junction protein expression levels in reflux esophagitis-affected mucosa. World J Gastroenterol 2009; 15(29): 3621-3630
- URL: https://www.wjgnet.com/1007-9327/full/v15/i29/3621.htm
- DOI: https://dx.doi.org/10.3748/wjg.15.3621


