Copyright
©2009 The WJG Press and Baishideng.
World J Gastroenterol. Jun 21, 2009; 15(23): 2900-2903
Published online Jun 21, 2009. doi: 10.3748/wjg.15.2900
Published online Jun 21, 2009. doi: 10.3748/wjg.15.2900
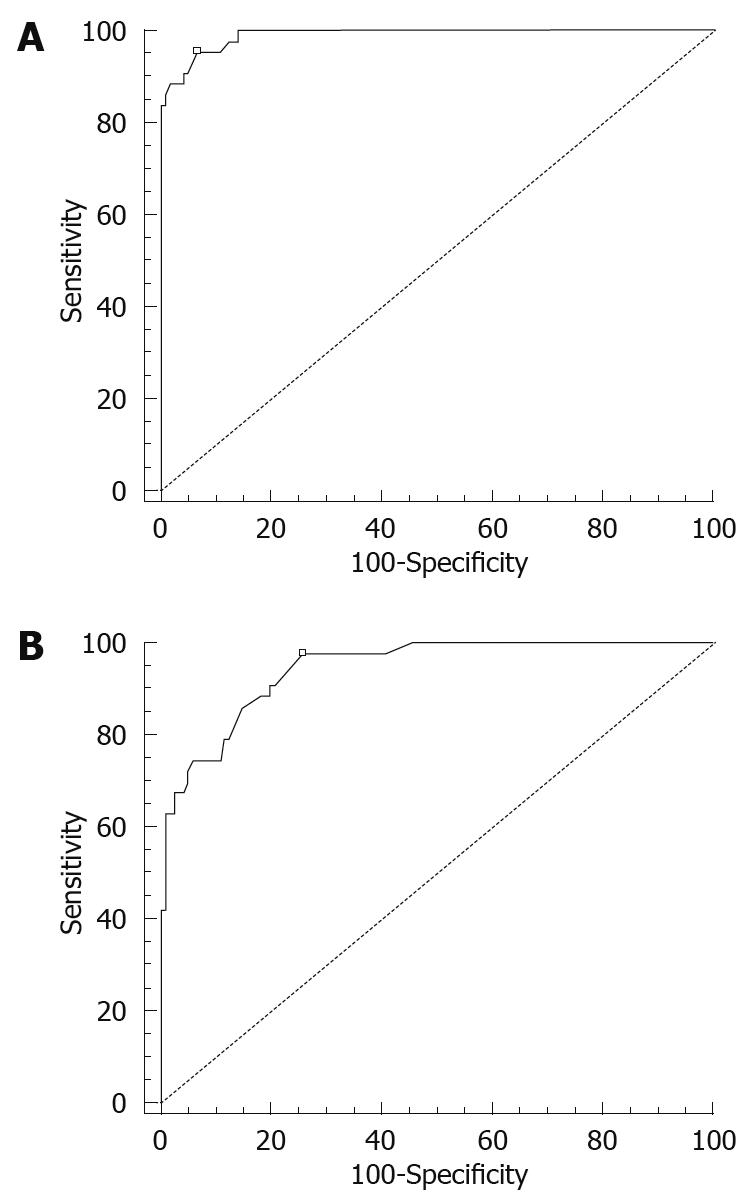
Figure 3 ROC curves of MOD (A) and MMT (B).
The optimal cut-off points are marked as white square boxes on the graphs.
- Citation: Je BK, Kim SB, Lee SH, Lee KY, Cha SH. Diagnostic value of maximal-outer-diameter and maximal-mural-thickness in use of ultrasound for acute appendicitis in children. World J Gastroenterol 2009; 15(23): 2900-2903
- URL: https://www.wjgnet.com/1007-9327/full/v15/i23/2900.htm
- DOI: https://dx.doi.org/10.3748/wjg.15.2900


