Copyright
©2009 The WJG Press and Baishideng.
World J Gastroenterol. Jun 21, 2009; 15(23): 2862-2869
Published online Jun 21, 2009. doi: 10.3748/wjg.15.2862
Published online Jun 21, 2009. doi: 10.3748/wjg.15.2862
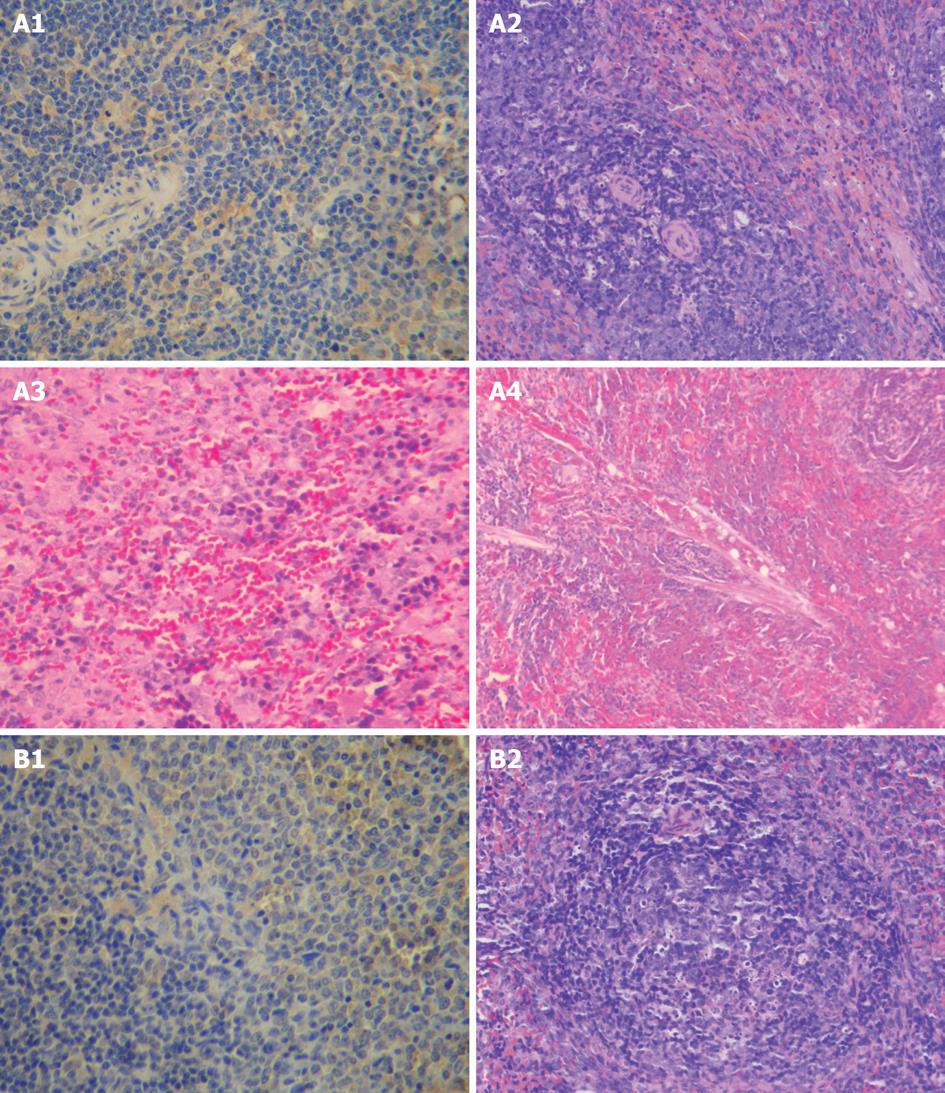
Figure 1 Pathological changes in spleen of model control group (A) and treatment group (B).
A1: 21 d. Spleen (++) (Bax, × 200); A2: 28 d. Thickening of the wall of small spleen arteries as well as expansion and congestion of the red pulp (HE, × 200); A3: 28 d. Enlargement of spleen sinusoid, hyperplasia of cells in the spleen sinus as well as inflammatory cell infiltration and hemorrhage (HE, × 200); A4: 28 d. Enlargement of spleen sinusoid and hyperplasia of fibrous tissue (HE, × 100); B1: 21 d. Spleen (+) (Bax, × 200); B2: 28 d. Focal necrosis in spleen lymphoid follicles (HE, × 100).
-
Citation: Zhang RP, Zhang XP, Ruan YF, Ye SY, Zhao HC, Cheng QH, Wu DJ. Protective effect of
Radix Astragali injection on immune organs of rats with obstructive jaundice and its mechanism. World J Gastroenterol 2009; 15(23): 2862-2869 - URL: https://www.wjgnet.com/1007-9327/full/v15/i23/2862.htm
- DOI: https://dx.doi.org/10.3748/wjg.15.2862


