Copyright
©2009 The WJG Press and Baishideng.
World J Gastroenterol. May 14, 2009; 15(18): 2228-2233
Published online May 14, 2009. doi: 10.3748/wjg.15.2228
Published online May 14, 2009. doi: 10.3748/wjg.15.2228
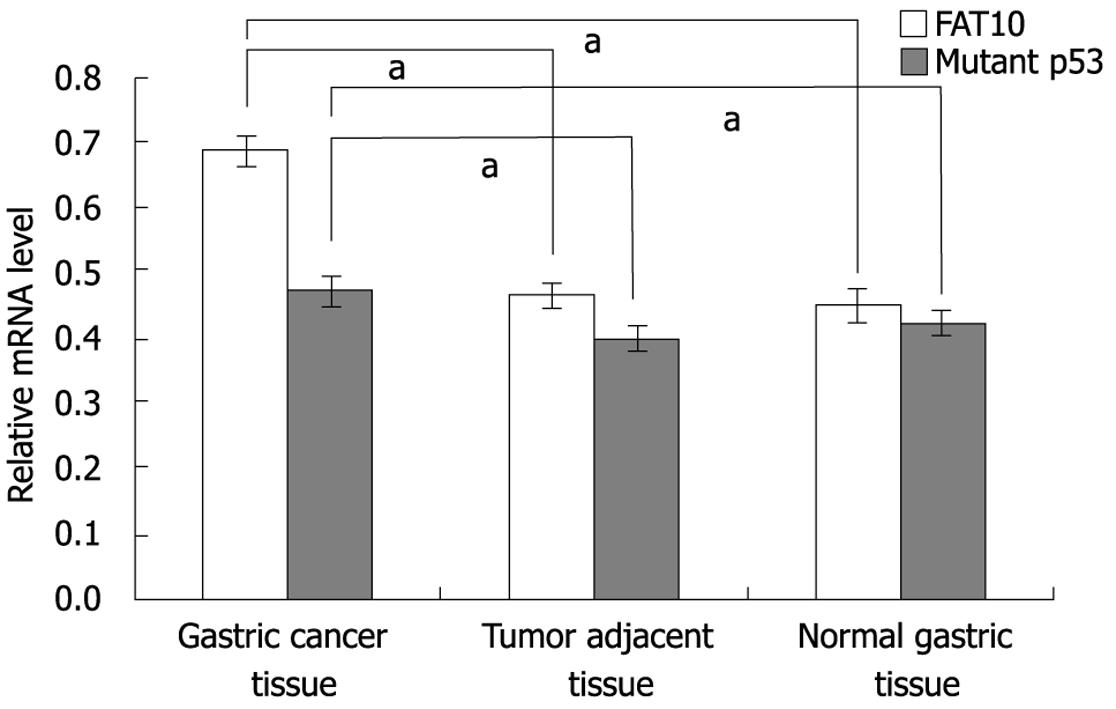
Figure 2 Relative mRNA levels of FAT10 and mutant p53 in different tissues.
The column represents the relative gray values of FAT10 and mutant p53 mRNA by normalizing the gray value of β-actin. aP < 0.05 (for FAT10: 0.689 ± 0.023 in gastric cancer tissue, 0.463 ± 0.019 in tumor adjacent tissue, 0.451 ± 0.028 in normal gastric tissue; for mutant p53: 0.471 ± 0.021 in gastric cancer tissue, 0.398 ± 0.017 in tumor adjacent tissue, 0.421 ± 0.019 in normal gastric tissue).
- Citation: Ji F, Jin X, Jiao CH, Xu QW, Wang ZW, Chen YL. FAT10 level in human gastric cancer and its relation with mutant p53 level, lymph node metastasis and TNM staging. World J Gastroenterol 2009; 15(18): 2228-2233
- URL: https://www.wjgnet.com/1007-9327/full/v15/i18/2228.htm
- DOI: https://dx.doi.org/10.3748/wjg.15.2228


