Copyright
©2009 The WJG Press and Baishideng.
World J Gastroenterol. Apr 21, 2009; 15(15): 1829-1835
Published online Apr 21, 2009. doi: 10.3748/wjg.15.1829
Published online Apr 21, 2009. doi: 10.3748/wjg.15.1829
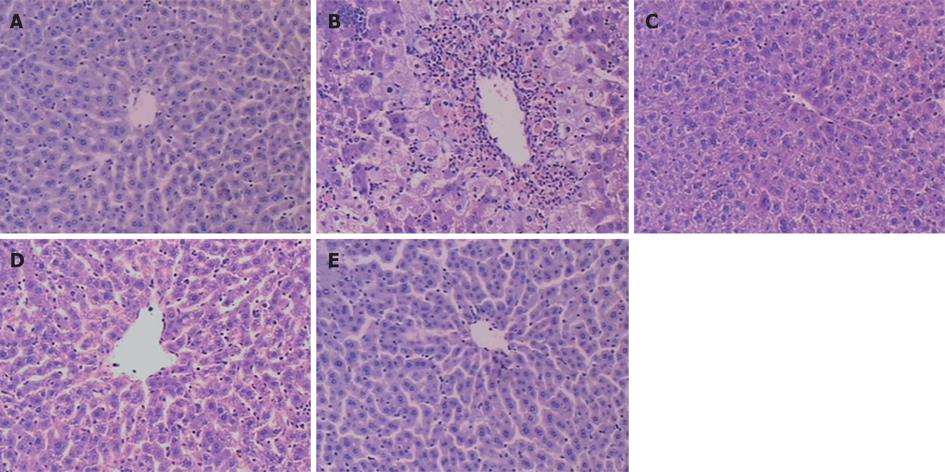
Figure 2 Changes of HE staining in liver tissue of mice 24 h after paracetamol administration (× 100) in control group with a normal central lobular region (A), model group with some central lobular hepatocyte necrosis and microvesicular fatty change (B), low TP dose group (C), medium TP dose group (D) and high TP dose group (E).
The pathological change of liver was much milder in different TP dose groups than in model group.
- Citation: Chen X, Sun CK, Han GZ, Peng JY, Li Y, Liu YX, Lv YY, Liu KX, Zhou Q, Sun HJ. Protective effect of tea polyphenols against paracetamol-induced hepatotoxicity in mice is significanly correlated with cytochrome P450 suppression. World J Gastroenterol 2009; 15(15): 1829-1835
- URL: https://www.wjgnet.com/1007-9327/full/v15/i15/1829.htm
- DOI: https://dx.doi.org/10.3748/wjg.15.1829


