Copyright
©2008 The WJG Press and Baishideng.
World J Gastroenterol. Feb 7, 2008; 14(5): 812-814
Published online Feb 7, 2008. doi: 10.3748/wjg.14.812
Published online Feb 7, 2008. doi: 10.3748/wjg.14.812
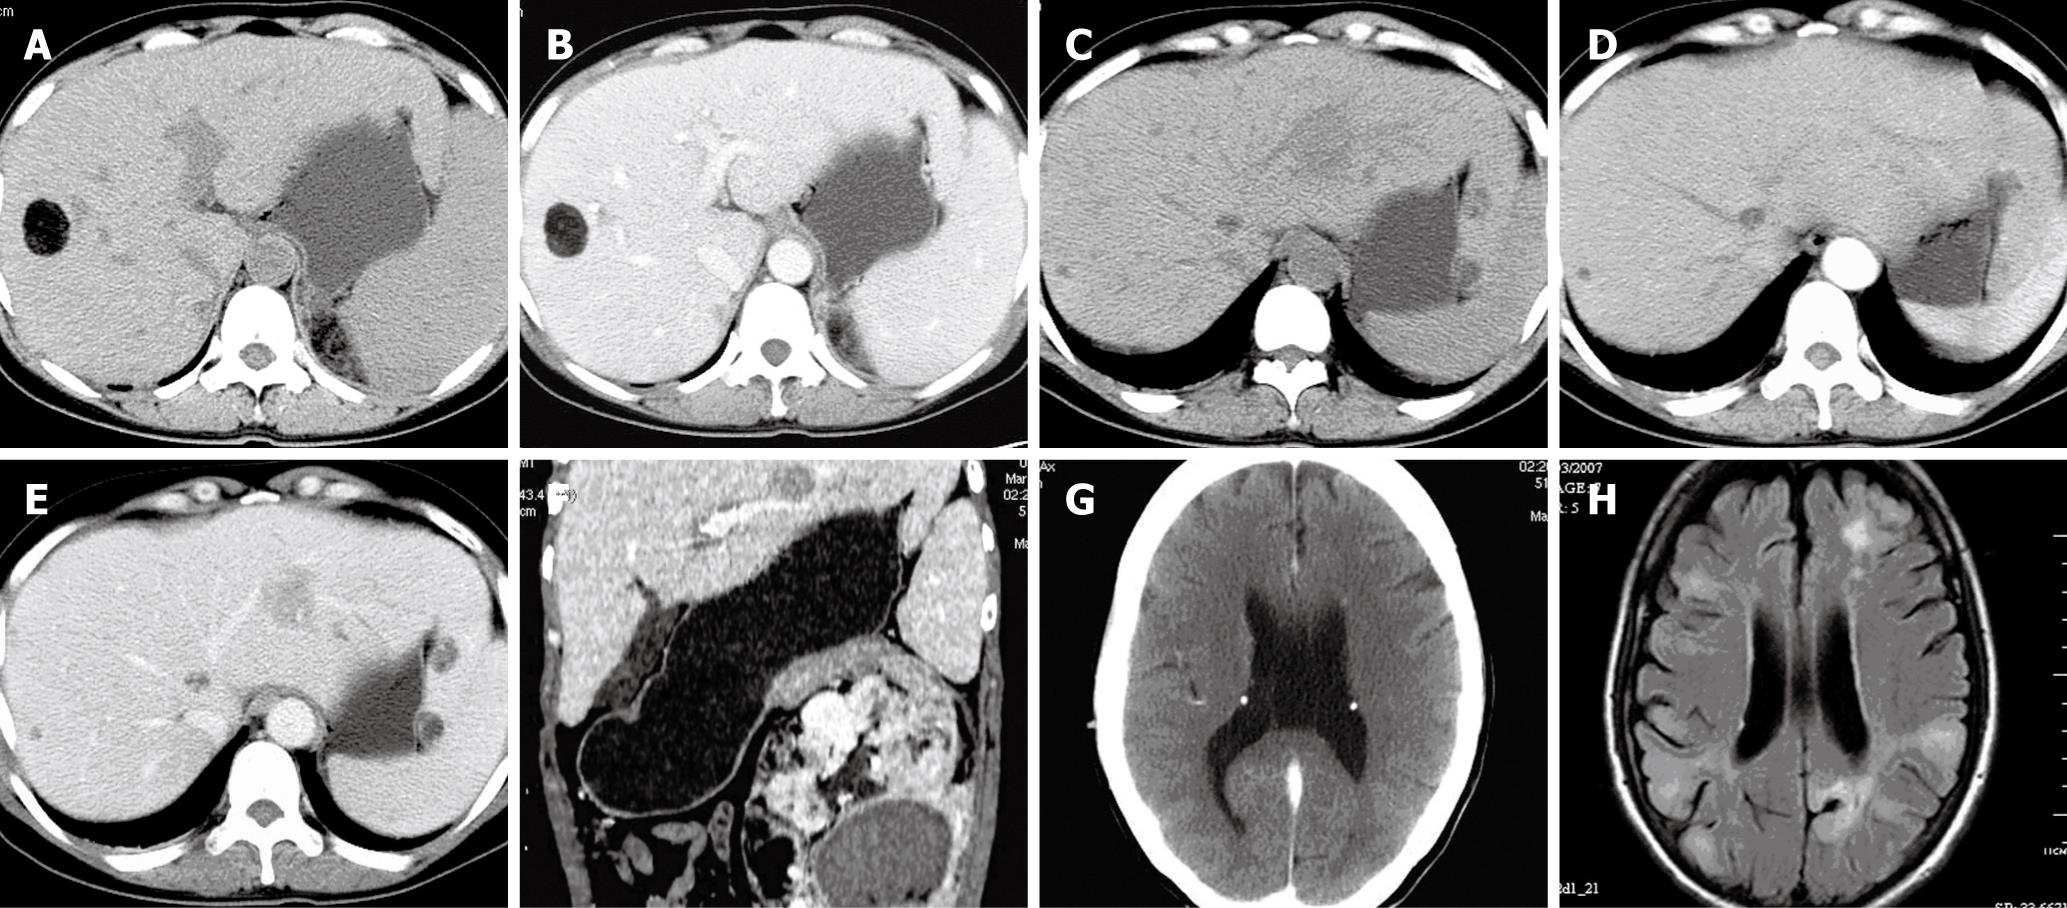
Figure 1 Photocopy detect of the patient.
A: Plain helical CT scan demonstrats a round well defined nodule with fat component in the liver; B: Enhanced CT scan shows that the non-fat component of the lesion is mildly enhanced; C: Plain CT scan shows an entire solid mass with no fat component in the left liver lobe and multiple distributed nodules with variable fat components in the liver; D: Enhanced CT shows the solid mass with no fat component in the left liver lobe as nearly homogeneous isodensity in the arterial phase; E: Enhanced CT scan shows the solid mass in the left liver lobe as hypodensity with dotted vessel in the portal venous phase; F: Coronal reconstruction images shows that the mass is adjacent to the left portal vein, and a left giant renal heterogeneous mass with fatty density and hemorrhage is noted; G: Cerebral CT scan demonstrats symmetrical subependymal calcified tuber; H: FLAIR MR imaging shows multiple cortical tubers with high signal intensity in the bilateral hemisphere, linear and irregular spherical high signal areas from periventricular to subcortical regions in the left occipital and frontal lobes.
- Citation: Yang B, Chen WH, Shi PZ, Xiang JJ, Xu RJ, Liu JH. Coincidence of hepatocelluar carcinoma and hepatic angiomyolipomas in tuberous sclerosis complex: A case report. World J Gastroenterol 2008; 14(5): 812-814
- URL: https://www.wjgnet.com/1007-9327/full/v14/i5/812.htm
- DOI: https://dx.doi.org/10.3748/wjg.14.812


