Copyright
©2008 The WJG Press and Baishideng.
World J Gastroenterol. Dec 28, 2008; 14(48): 7335-7344
Published online Dec 28, 2008. doi: 10.3748/wjg.14.7335
Published online Dec 28, 2008. doi: 10.3748/wjg.14.7335
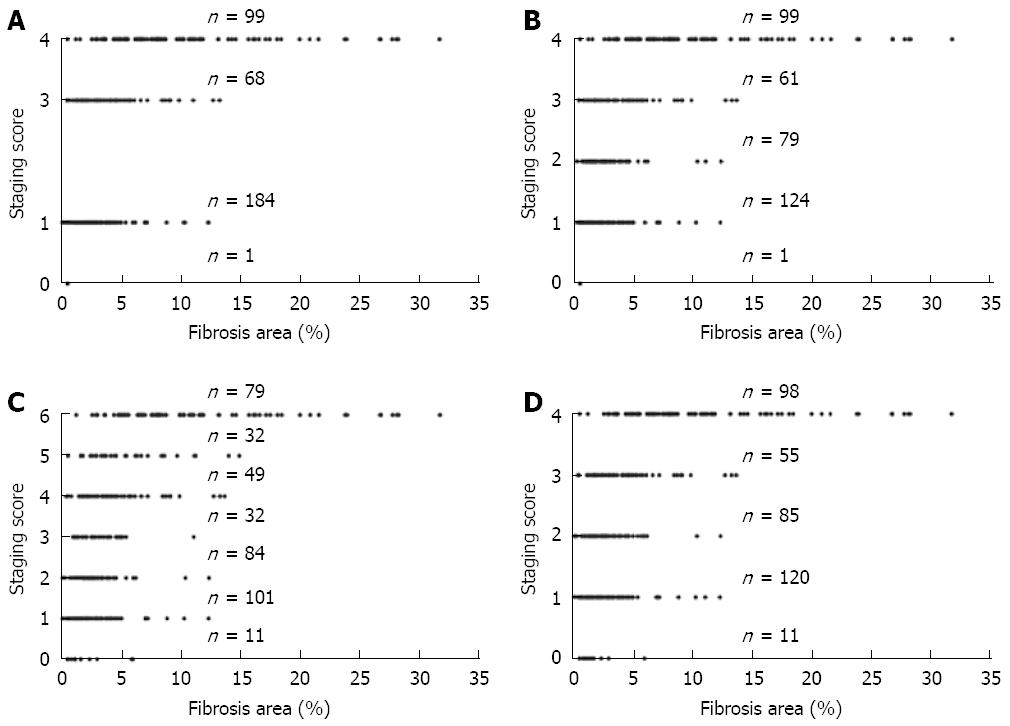
Figure 8 Comparison of the phase portraits obtained using the scalar values of fibrosis (%) calculated from each biopsy section, projected onto the state spaces.
A: Knodell HAI; B: Sheuer; C: Ishak; and D: METAVIR categories (staging). All graphs highlight a considerable overlap of scalar data that corresponds to different categories. Forty-six cases for HAI, 34 for Sheuer, 10 for Ishak and 29 for METAVIR resulted uncertain to be classified in a unique category of severity.
- Citation: Dioguardi N, Grizzi F, Fiamengo B, Russo C. Metrically measuring liver biopsy: A chronic hepatitis B and C computer-aided morphologic description. World J Gastroenterol 2008; 14(48): 7335-7344
- URL: https://www.wjgnet.com/1007-9327/full/v14/i48/7335.htm
- DOI: https://dx.doi.org/10.3748/wjg.14.7335


