Copyright
©2008 The WJG Press and Baishideng.
World J Gastroenterol. Dec 21, 2008; 14(47): 7175-7182
Published online Dec 21, 2008. doi: 10.3748/wjg.14.7175
Published online Dec 21, 2008. doi: 10.3748/wjg.14.7175
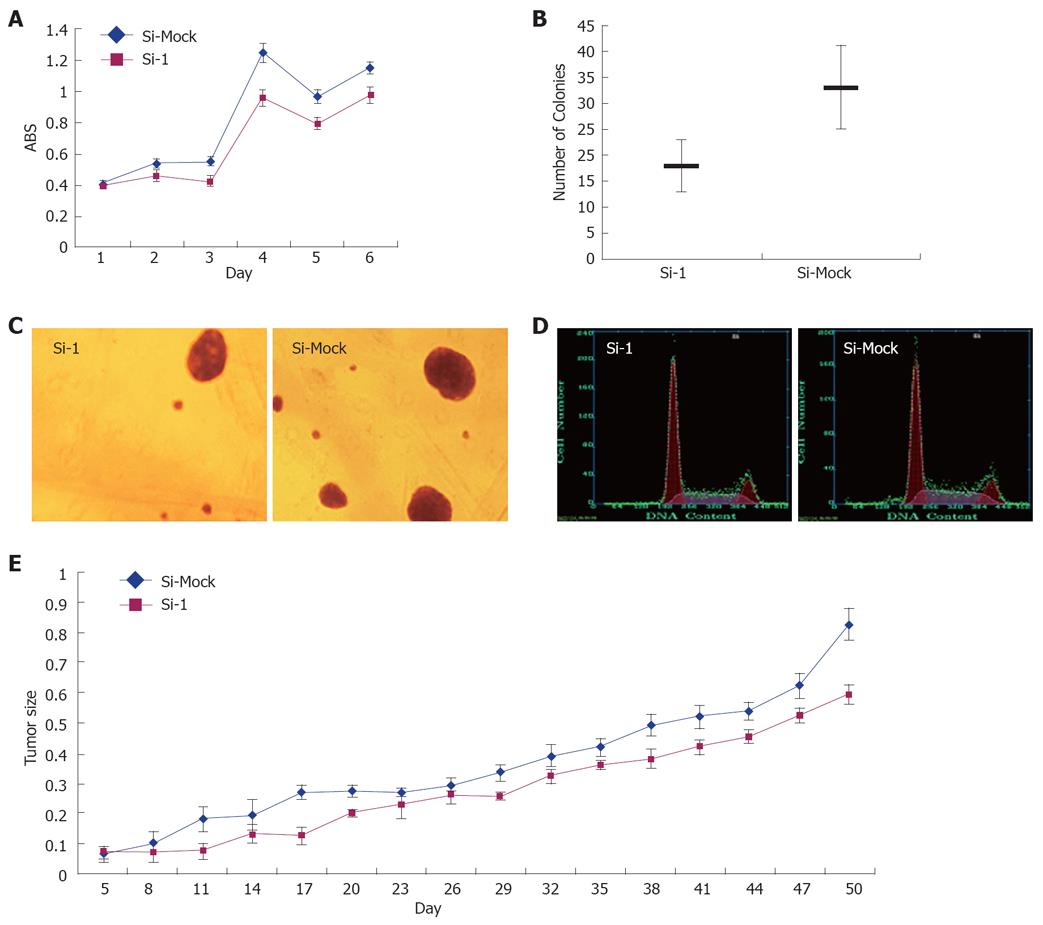
Figure 2 Effect of GABRA3-siRNA on the growth of HCC cells.
A: MTT assay of HepG2 cells transfected with Si-1 vectors to GABRA3 and a negative control vector (Si-Mock). Y-axis: Average value of absorbance (ABS) at 570 nm, measured with a microplate reader (n = 6, P < 0.05); B and C: Soft agar colony formation assay of HepG2/Si-1 and HepG2/Si-Mock. Same cells were incubated in low-melting agarose as described in Materials and Methods. Two weeks later, colonies were photographed and numbers of colonies were counted. (n = 3, P < 0.05); D: Cell cycle of HepG2/Si-1 and HepG2/Si-Mock measured by flow cytometry; E: Tumor volume in nude mice with HepG2/Si-1 or HepG2/Si-Mock injected (mm3).
- Citation: Liu Y, Li YH, Guo FJ, Wang JJ, Sun RL, Hu JY, Li GC. Gamma-aminobutyric acid promotes human hepatocellular carcinoma growth through overexpressed gamma-aminobutyric acid A receptor α3 subunit. World J Gastroenterol 2008; 14(47): 7175-7182
- URL: https://www.wjgnet.com/1007-9327/full/v14/i47/7175.htm
- DOI: https://dx.doi.org/10.3748/wjg.14.7175


