Copyright
©2008 The WJG Press and Baishideng.
World J Gastroenterol. Nov 28, 2008; 14(44): 6844-6852
Published online Nov 28, 2008. doi: 10.3748/wjg.14.6844
Published online Nov 28, 2008. doi: 10.3748/wjg.14.6844
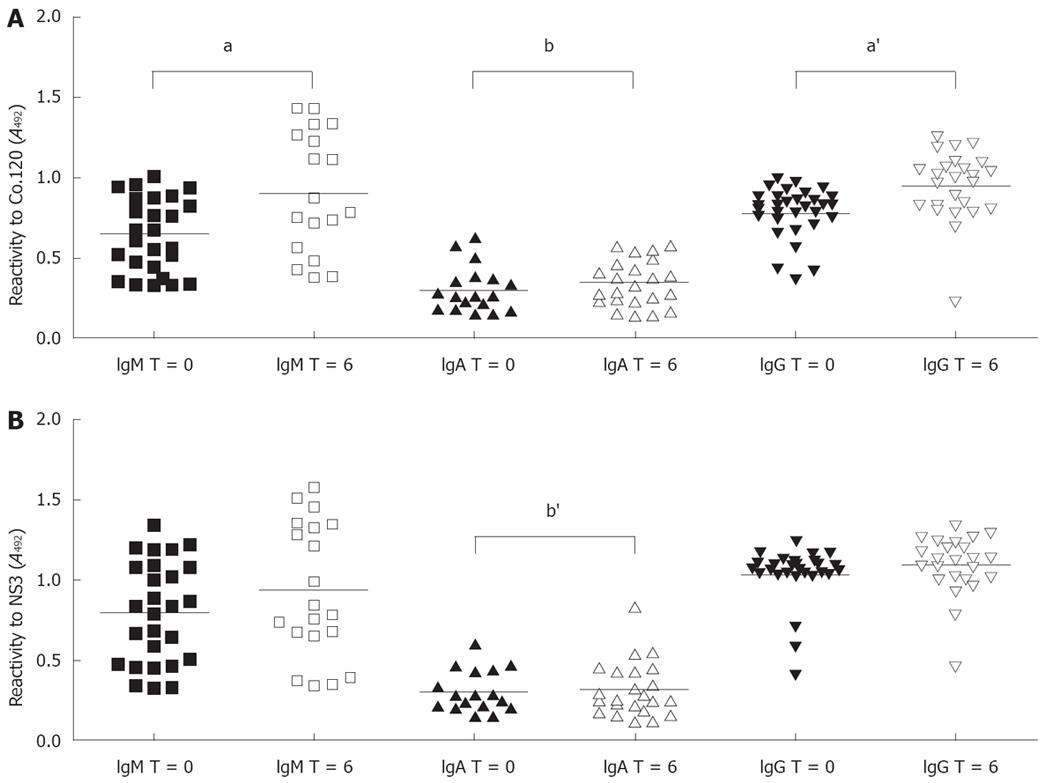
Figure 1 Comparison of antibody reactivity to HCV recombinant Co.
120 (A) and NS3 (B) proteins in serum samples from baseline (T = 0) and 6 mo (T = 6) of follow-up. Symbols represent individual values. Only samples showing a positive reactivity are displayed. The horizontal lines represent mean values. Letters over brackets indicate statistical significance (a denotes differences in response magnitude, aP = 0.027, a'P = 0.0006; b denotes differences in the number of positive samples, bP = 0.017, b'P = 0.005).
- Citation: Amador-Cañizares Y, Alvarez-Lajonchere L, Guerra I, Rodríguez-Alonso I, Martínez-Donato G, Triana J, González-Horta EE, Pérez A, Dueñas-Carrera S. Induction of IgA and sustained deficiency of cell proliferative response in chronic hepatitis C. World J Gastroenterol 2008; 14(44): 6844-6852
- URL: https://www.wjgnet.com/1007-9327/full/v14/i44/6844.htm
- DOI: https://dx.doi.org/10.3748/wjg.14.6844


