Copyright
©2008 The WJG Press and Baishideng.
World J Gastroenterol. Nov 14, 2008; 14(42): 6473-6480
Published online Nov 14, 2008. doi: 10.3748/wjg.14.6473
Published online Nov 14, 2008. doi: 10.3748/wjg.14.6473
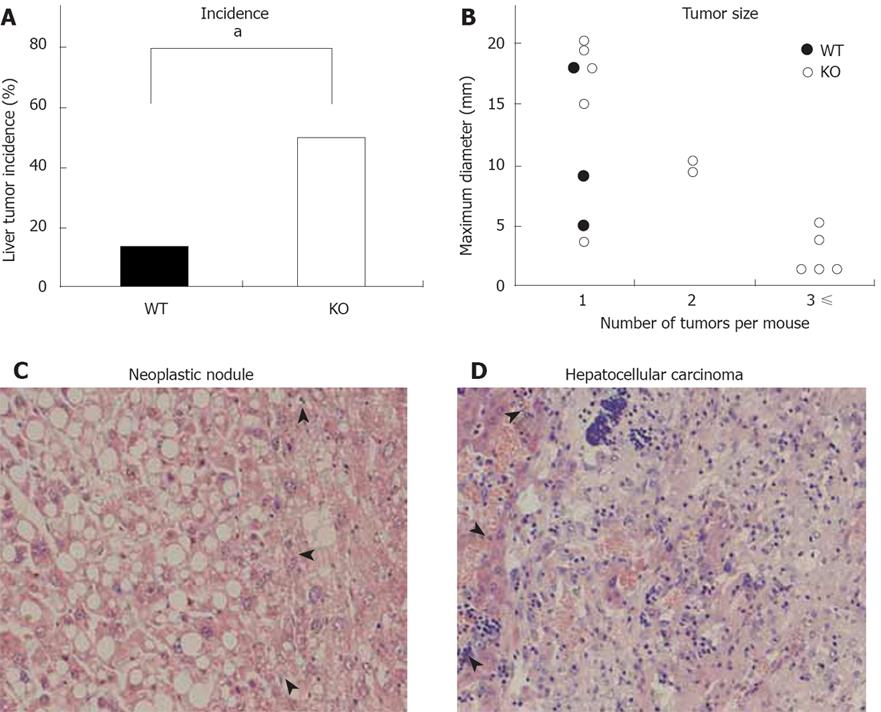
Figure 5 Enhanced AOM-induced liver tumor formations in KO mice.
A: Tumor incidence is expressed as the ratio of mice with tumor/total number of mice (aP < 0.05; Fisher’s exact probability test); B: Tumor size is evaluated by its maximum diameter. Mice were divided into three groups according to the number of tumors per mouse. Maximum diameter of the tumors is plotted individually in each group. WT mice (n = 3), KO mice (n = 12). C and D: Representative HE-stained sections liver tumors in KO mice (× 200). Arrowheads indicate liver tumors. C: Neoplastic nodule; D: Hepatocellular carcinoma.
- Citation: Nishihara T, Baba M, Matsuda M, Inoue M, Nishizawa Y, Fukuhara A, Araki H, Kihara S, Funahashi T, Tamura S, Hayashi N, Iishi H, Shimomura I. Adiponectin deficiency enhances colorectal carcinogenesis and liver tumor formation induced by azoxymethane in mice. World J Gastroenterol 2008; 14(42): 6473-6480
- URL: https://www.wjgnet.com/1007-9327/full/v14/i42/6473.htm
- DOI: https://dx.doi.org/10.3748/wjg.14.6473


