Copyright
©2008 The WJG Press and Baishideng.
World J Gastroenterol. Sep 21, 2008; 14(35): 5467-5470
Published online Sep 21, 2008. doi: 10.3748/wjg.14.5467
Published online Sep 21, 2008. doi: 10.3748/wjg.14.5467
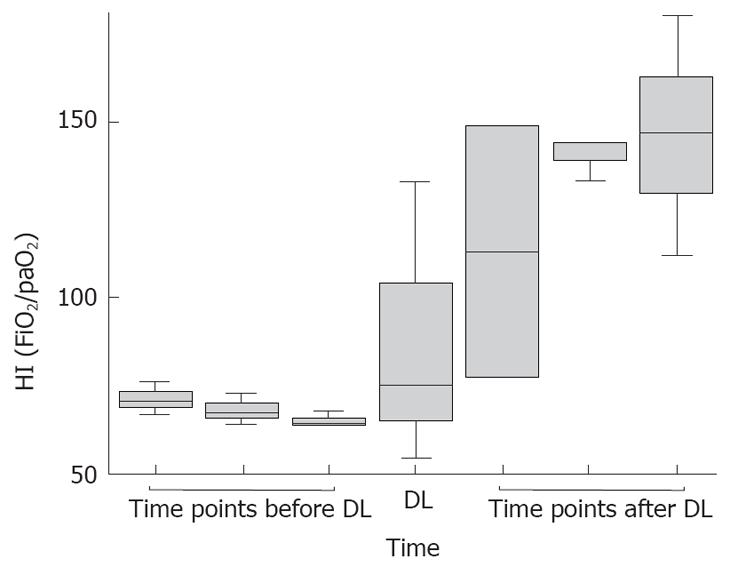
Figure 3 Development of Horowitz-indices (HI).
In the Box blots, the HI 3, 2 and 1 d before, at and 1, 2 and 3 d after DL of all 3 patients is shown. The line refers to the median, whereas the boxes refer to the interquartile ranges. The whiskers represent the 5th and 95th percentiles, respectively.
- Citation: Siebig S, Iesalnieks I, Bruennler T, Dierkes C, Langgartner J, Schoelmerich J, Wrede CE. Recovery from respiratory failure after decompression laparotomy for severe acute pancreatitis. World J Gastroenterol 2008; 14(35): 5467-5470
- URL: https://www.wjgnet.com/1007-9327/full/v14/i35/5467.htm
- DOI: https://dx.doi.org/10.3748/wjg.14.5467


