Copyright
©2008 The WJG Press and Baishideng.
World J Gastroenterol. Sep 7, 2008; 14(33): 5176-5185
Published online Sep 7, 2008. doi: 10.3748/wjg.14.5176
Published online Sep 7, 2008. doi: 10.3748/wjg.14.5176
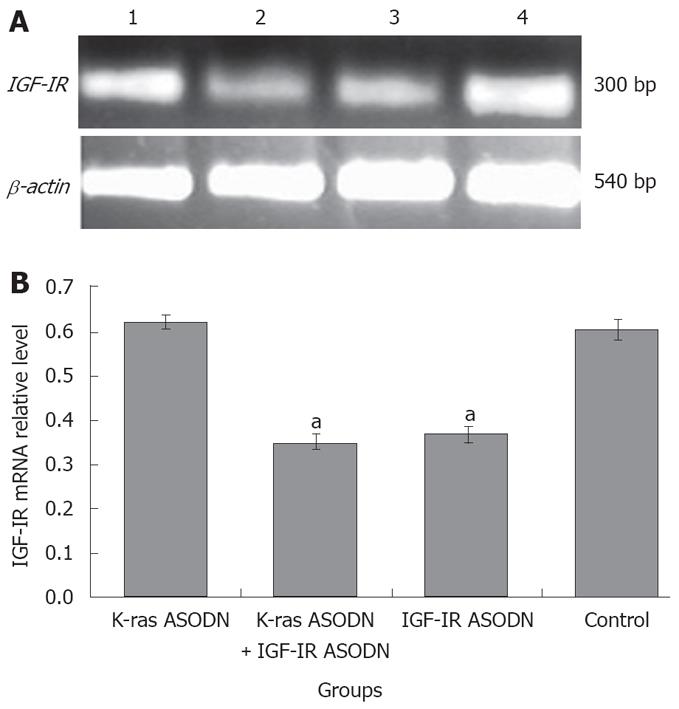
Figure 6 mRNA expression of IGF-IR gene in Patu8988 cells at 48 h post-transfection.
A: RT-PCR analysis for IGF-IR gene in different groups. The β-actin gene was included as internal control. 1: K-ras ASODN group; 2: K-ras ASODN + IGF-IR ASODN; 3: IGF-IR ASODN group; 4: Control group; B: IGF-IR products quantified relative to the internal control β-actin. aP < 0.05 vs control. Each value represents the mean ± SD from triplicate determinations.
- Citation: Shen YM, Yang XC, Yang C, Shen JK. Enhanced therapeutic effects for human pancreatic cancer by application K-ras and IGF-IR antisense oligodeoxynucleotides. World J Gastroenterol 2008; 14(33): 5176-5185
- URL: https://www.wjgnet.com/1007-9327/full/v14/i33/5176.htm
- DOI: https://dx.doi.org/10.3748/wjg.14.5176


