Copyright
©2008 The WJG Press and Baishideng.
World J Gastroenterol. Jul 28, 2008; 14(28): 4546-4550
Published online Jul 28, 2008. doi: 10.3748/wjg.14.4546
Published online Jul 28, 2008. doi: 10.3748/wjg.14.4546
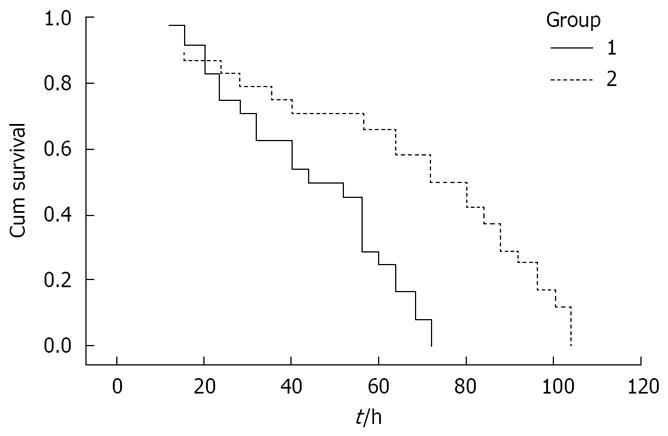
Figure 2 Kaplan-Meier survival curves of SAP rats.
1: SAP group; 2: Delayed EP treatment group. Log-rank test, P = 0.0006; Breslow test, P = 0.0050.
-
Citation: Yang ZY, Ling Y, Yin T, Tao J, Xiong JX, Wu HS, Wang CY. Delayed ethyl pyruvate therapy attenuates experimental severe acute pancreatitis
via reduced serum high mobility group box 1 levels in rats. World J Gastroenterol 2008; 14(28): 4546-4550 - URL: https://www.wjgnet.com/1007-9327/full/v14/i28/4546.htm
- DOI: https://dx.doi.org/10.3748/wjg.14.4546


